Reading and preparing an elevation profile before a trail or hiking outing
Two routes of the same distance can demand a completely different effort. The elevation profile makes the difference — you just need to know how to read it.
What an elevation profile shows
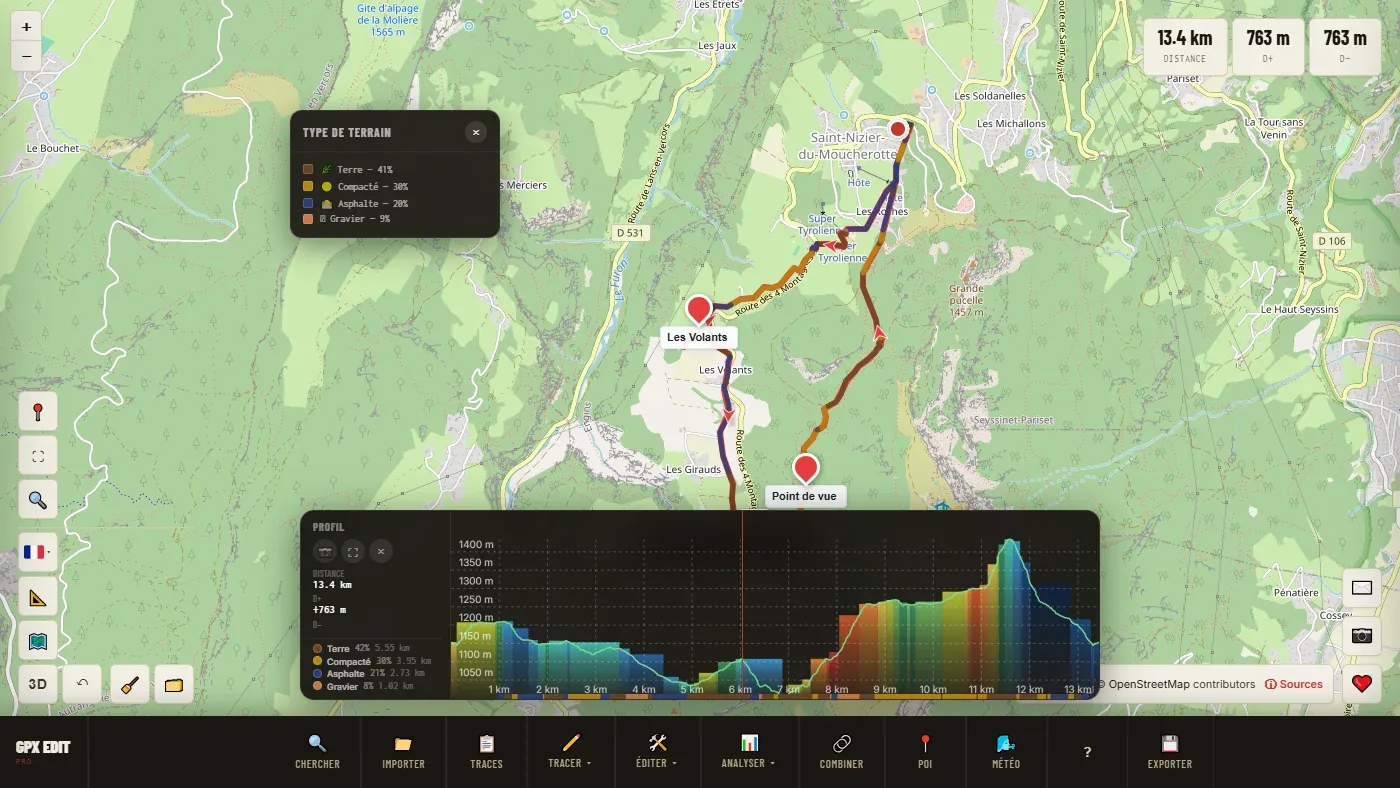
An elevation profile plots distance covered on the horizontal axis and altitude on the vertical one. A climb reads as an upward slope, a descent as a downward one. Two figures sum it all up: ascent (the total of every climb) and descent (the total of every drop). On a loop that returns to its starting point, these two figures come out close to each other.
📖 Step by step in the manual: Elevation profile · Slope by color
A rough guide to judging a gradient
A gradient percentage rarely speaks for itself. As a rule of thumb: a typical walking track sits around 5 to 10%, a sustained climb starts around 15%, and a technical scramble goes past 25% — beyond that, walking gives way to using your hands in places. On the profile, rely on the calculated percentages and the gradient colouring rather than on how steep the curve looks, which depends on the chart's scales.
Why raw GPS altitude isn't always reliable
A GPS altitude can be imprecise, especially when satellite reception degrades. On devices with a barometric altimeter, atmospheric pressure can also cause drift: a change in the weather mid-outing can shift an entire track by several dozen metres. That's why a correction is worth applying before trusting the ascent figure shown.
The correction relies on a digital elevation model — IGN RGE ALTI in France, Copernicus GLO-90 elsewhere — to correct the slow drift of the barometer while preserving the usable details of the measurement. Missing altitudes are filled in from the elevation model.
What to do about a profile that looks off
An isolated spike of several hundred metres at a single point, or a sudden drop immediately followed by an equally sudden climb, almost always points to a bad GPS fix rather than a real feature of the terrain — a satellite briefly lost under dense tree cover, for instance. Elevation correction fixes the slow drift of the barometer, not a single stray point. For a point whose altitude is wrong, the "Edit points" tool lets you click the point and correct its value; for a point that has strayed far from the path, "Clean up" finds it and removes it, with a preview.
📖 Step by step in the manual: Correct elevation · Edit points · Clean up
Spotting difficult sections before you set off
The profile can be scrubbed directly: hovering with a mouse or finger over the curve shows the matching point on the map, letting you pinpoint a col or a technical descent precisely. A section of the profile can also be selected to isolate a segment and look at it on its own.
Gradient colouring makes this reading even faster: the steepest sections stand out visually, with no need to interpret the raw curve.
Cross-referencing ascent with ground surface
The same gradient percentage doesn't demand the same effort on tarmac, gravel or soft dirt. Layering the ascent reading on top of the track's surface detection gives a fuller picture of an outing's real difficulty than the ascent figure alone.
Trail or hiking: the same gradient, a different read
A trail runner and a hiker don't look at the same profile the same way. The runner mainly looks for the "runnable" stretches — ones with a gentle enough gradient to keep running — and spots in advance the sections that will need walking, or even hands. The hiker thinks more in terms of cumulative fatigue over the day: a sawtooth profile, with many small climbs and drops, often wears you down more than a single continuous climb of the same total ascent.
Using the profile to estimate effort
Ascent and distance combined let you estimate a realistic duration for the activity. A dedicated simulation exists for seven different sport profiles — walking, trail, MTB, road cycling, among others — each with its own relationship between flat distance and elevation climbed. Two 15 km outings can show very different estimated durations depending on whether they total 300 or 1,200 metres of ascent, which lets you set a realistic departure time instead of finding out along the way.
Ready to try it on your own track?
Open the GPX editor for free →