Before you start
GPX Edit Pro is a GPS track editor that runs in your browser. It is used to prepare a route before you leave, and to fix a file recorded on your return.
Three things to know
No account needed. Open the page, work, download your file. Nothing to create, nothing to remember.
Your files don't leave your device. When you import a track, it is read on the spot, in your browser. Some features query an online service, and only when you run them: route calculation, elevation correction, weather, place search. In those cases, only the coordinates needed for the calculation are sent, not your file. Two features really put your tracks online, and they tell you so beforehand: 🔗 Share and the QR code option of the PDF map.
Your work is kept in this browser, not anywhere else. If you close the tab, your tracks are restored the next time you open the editor, on the same device and in the same browser. But they don't follow you to another device, and they disappear if you clear the browser's data. To keep a track for good, export it. The chapter Is your work saved? explains everything.
The file that counts is the one you exported with 💾 Export. The automatic save is a safety net, not a storage place.
A little vocabulary
| Word | What it means here |
|---|---|
| Track | The path itself: a series of connected points, with their coordinates, their elevation and sometimes their time. It is the object you work on. |
| Point | A position on the track. A watch often records one per second: a three-hour outing contains several thousand. |
| GPX | The universal GPS track file format. All GPS devices, watches and apps read it. |
| Ascent / Descent | Ascent (D+ in French): the sum of all the climbs. Descent: the sum of all the descents. The ascent is what tells you whether it is going to be hard. |
| Marker | A single point you place on the map (a spring, a car park). GPS devices call it a waypoint. It is independent of the track and goes with it when you export. |
| POI | Point of interest: fountain, bakery, train station, mountain hut… The tool searches for them along your route. |
| Terrain model (DEM) | A map of ground elevations. The tool uses it to give an elevation to tracks that have none and to correct those that drift. |
| Time-stamped track | A track in which every point carries a time: this is the case for outings recorded by a watch or a phone. A track drawn on the map has no times. |
What you need
An up-to-date browser (Firefox, Chrome, Edge, Safari) on a computer, tablet or phone. The tool works on a phone, but preparing a long route is more comfortable on a big screen. The chapter On a phone details the differences.
Your first track, in eight steps
Goal: arrive at an empty map and leave with a GPX file in your downloads. If you only read one chapter, read this one.
- Open the editor You see a map, a toolbar at the bottom of the screen, and buttons along the edges. That's normal: there is no track yet.
- Go to the right area Click 🔍 Search in the bottom bar, type the name of a town or a place, choose from the list. The map moves there. You can also zoom with the wheel and drag the map to move it.
- Open the drawing tool Click ✏️ Draw, then 🛣️ Via routing. This is the mode that follows existing roads and paths.
- Choose your activity A "Create a route" window opens on the right. At the top, a row of icons: click the one that fits (🥾 hiking, 🚴 road cycling, 🚵 MTB…). This choice decides which paths the calculation is allowed to use.
- Click on the map The first click sets the start. Each following click adds a point, and the route is calculated automatically between the two, along the paths. Wait for the section to appear before clicking the next point.
- Save When you are happy with the route, click ✔ Save. The track goes into the 📋 Tracks list and is shown in colour. Until you save, it is only a draft.
- Check (optional) 📊 Analyze → 📊 Elevation profile. A chart opens with the distance, the ascent and the terrain. Now is the time to discover that your "nice easy little loop" has 900 m of ascent.
- Export 💾 Export, leave the format on GPX, then Export now. The file lands in your downloads. You can load it onto your watch, your GPS or your app.
Forgetting step 6. Without ✔ Save, the route doesn't appear in the track list and the export finds nothing to export.
The screen and its areas
The interface fits into a few areas. Once you have spotted them, you no longer search.
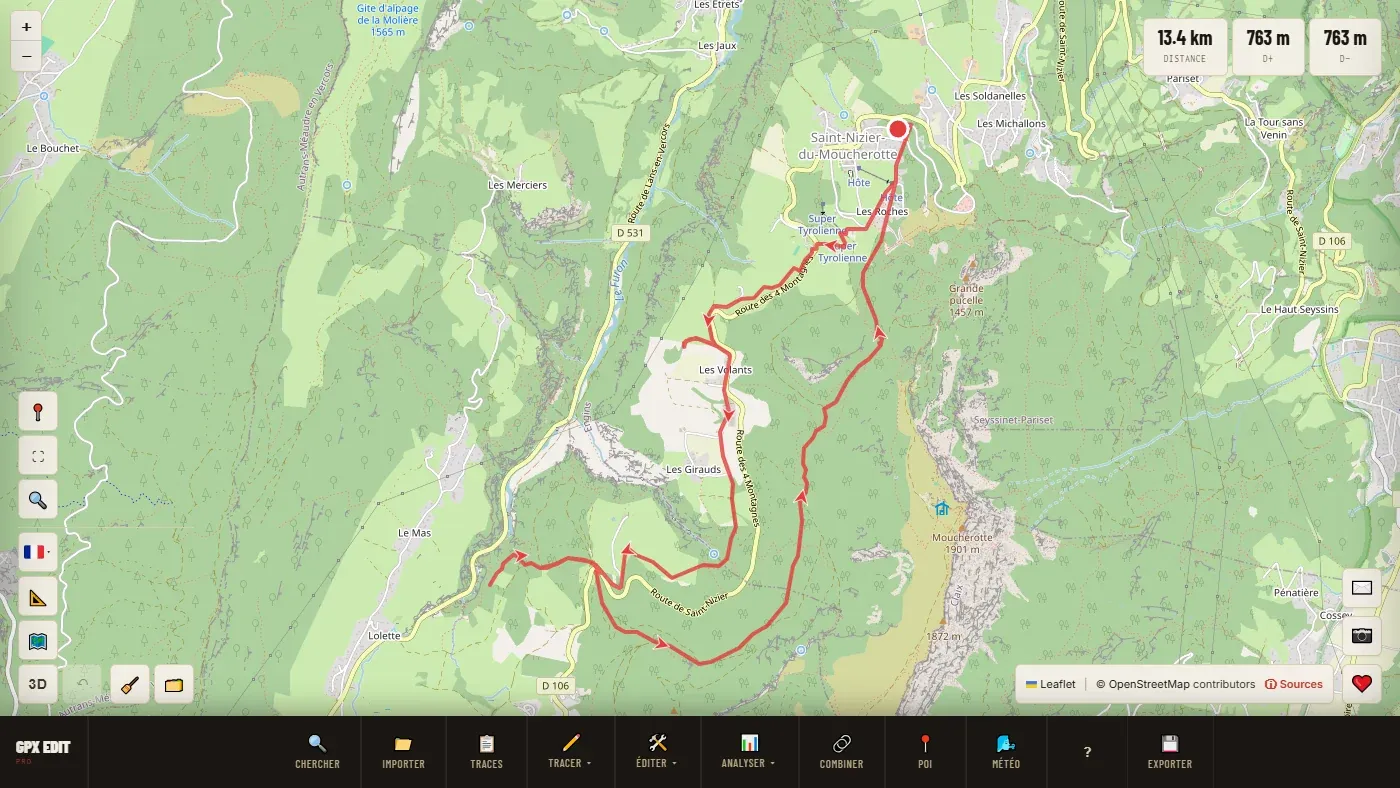 1
2
3
4
5
6
1
2
3
4
5
6
- The toolbar: everything starts here.
- The map buttons: location, fullscreen, fit all, language, units, basemap.
- 3D, ↶ Undo, 🧹 Delete all, 🗂️ My workspace.
- Distance, ascent and descent of the selected track (of all tracks if none is selected).
- Contact us, GPS photos, Support the project.
- The track: the dot marks the start, the arrows the direction, the labels the kilometres.
The toolbar, at the bottom #
| Button | What it does | |
|---|---|---|
| 🔍 | Search | Moves the map to a place: town, address, locality. |
| 📁 | Import | Opens one or more files (GPX, FIT, TCX, KML, KMZ, or a "My workspace" backup). |
| 📋 | Tracks | Opens the list of your tracks. |
| ✏️ | Draw | The three ways to create a track. |
| 🛠️ | Edit | All the changes: cut, reverse, simplify, clean up… |
| 📊 | Analyse | Profile, gradients, surfaces, sunlight, route card, comparison… |
| 🔗 | Combine | Looks for the biggest possible loop in a set of tracks. |
| 📍 | POI | Looks for useful points: water, food, shelters… |
| 🌬️ | Weather | The wind, wave and tide map, for wind and water sports. |
| ? | Keyboard shortcuts | The list of keyboard shortcuts, and a link to this manual. |
| 💾 | Export | Gets your work out as a file, a PDF map or a share link. |
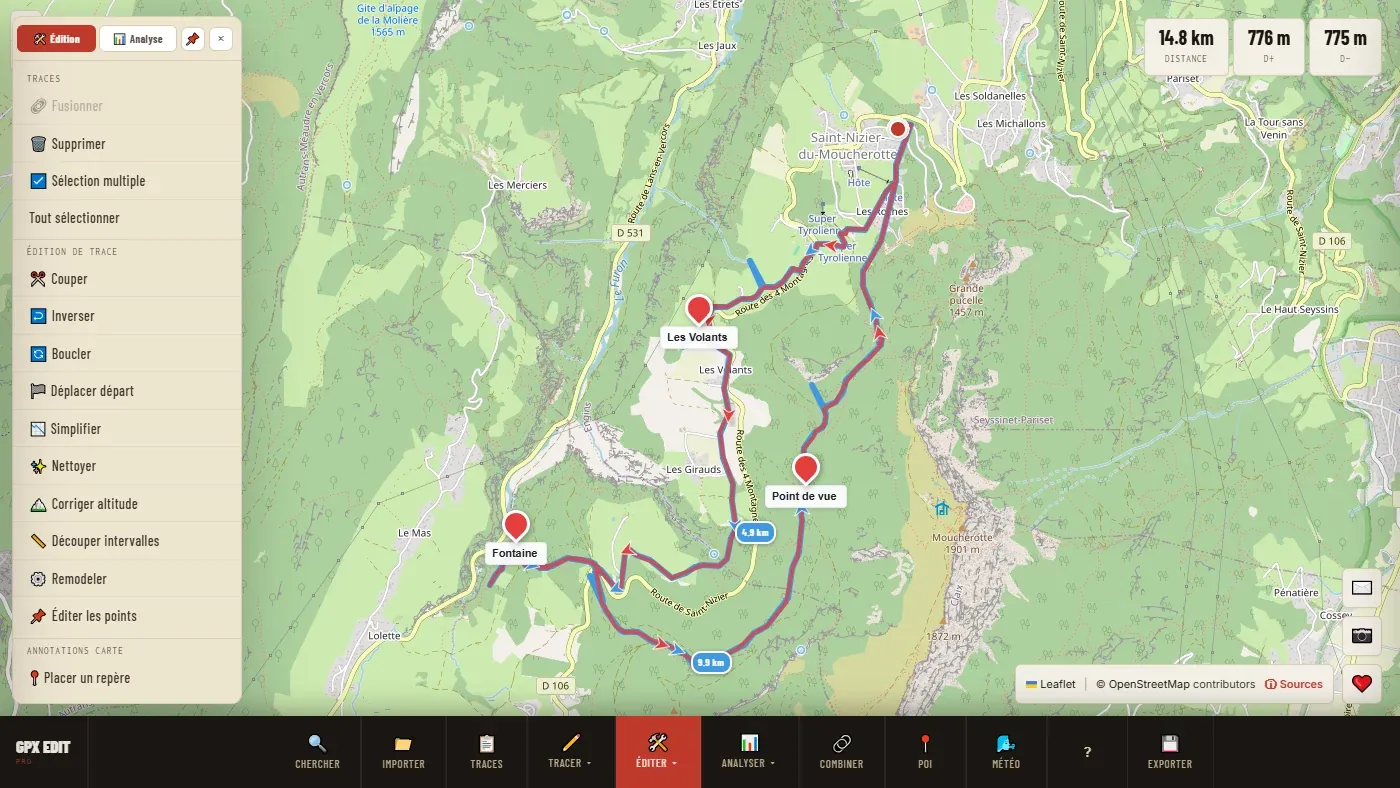
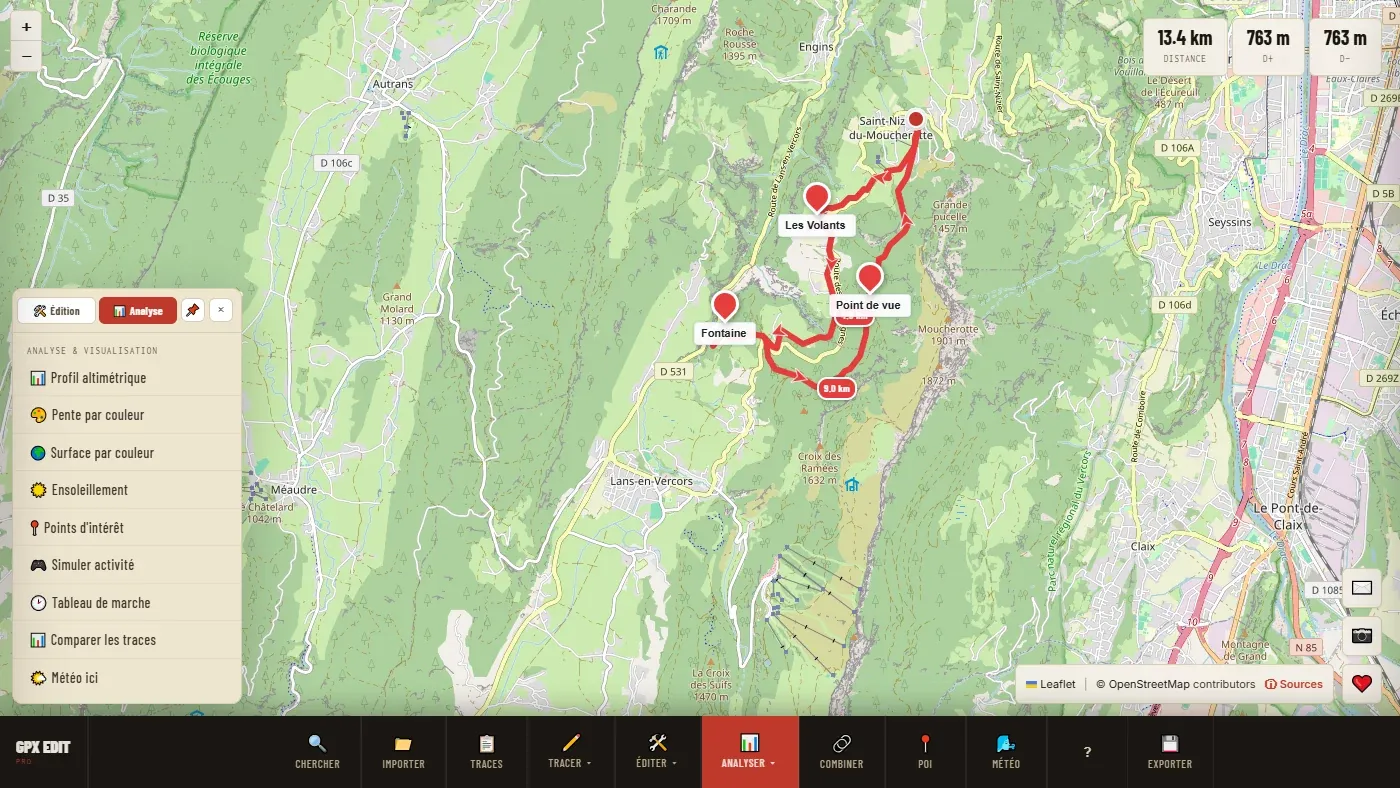
🛠️ Edit and 📊 Analyze open the same panel, on two tabs (🛠️ Edit and 📊 Analysis). You move this panel by dragging its header. The 📌 pin keeps it open while you work on the map.
A greyed-out button isn't broken. It is waiting for a selected track (or two, for Merge and Compare). Tick the track in the 📋 Tracks list, or click it on the map.
The map buttons #
At the bottom left, a column and a row of buttons.
| Button | What it does | |
|---|---|---|
| 📍 | My location | Shows your location and a compass. The browser asks for your permission. A second click stops it. |
| ⛶ | Fullscreen | The map fills the whole screen. |
| 🔍 | Fit all | Fits the map to all your tracks. Key F. |
| 🇫🇷 | Language | Eleven languages. |
| 📐 | Units | Kilometres or miles, °C or °F. |
| 🗺️ | Map background | Sixteen basemaps, from the standard map to IGN satellite imagery. |
| 3D | 3D view | Opens your tracks in relief, with a flyover video. |
| ↶ | Undo | Undoes the last operation. The operation's name is shown next to it. |
| 🧹 | Delete all | Empties the workspace: tracks, markers and POIs. You are asked to confirm. |
| 🗂️ | My workspace | Saves all your work to a file, or loads it back. |
At the bottom right: ✉️ Contact us, 📷 GPS photos and ❤️ Support the project. The + and − buttons at the top left zoom.
The track list #
Opened by 📋 Tracks. One row per track, with its distance, its ascent, its number of points and the chosen sport.
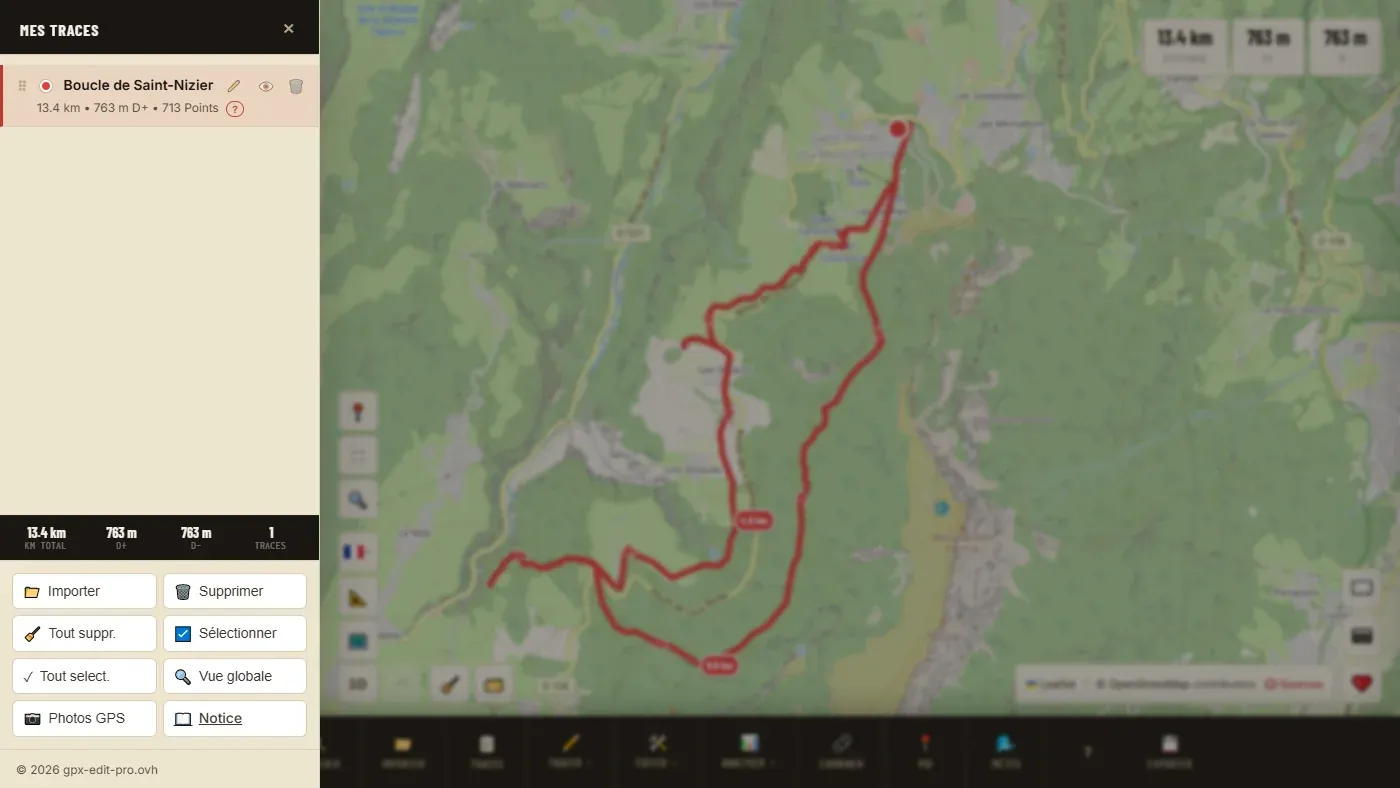
| On the row | What it does |
|---|---|
| Click on the row | Selects the track (a second click deselects it). Ctrl+click adds another one to the selection. |
| ⠿ | Drag to change the order of the tracks. |
| Colour dot | Changes the track's colour. |
| Name ✏️ | Click to rename (50 characters at most). |
| 👁️ / 🙈 | Hides or shows the track again. A hidden track can't be selected. |
| 🗑️ | Deletes the track, after confirmation. |
| Sport icon, or ? | Chooses the track's sport. See A track's sport. |
At the bottom of the panel: 📁 Import, 🗑️ Delete (the selection), 🧹 Clear all, ☑️ Select (multi-select), ✓ Sel. all, 🔍 Fit all, 📷 GPS photos and 📖 Manual. On a phone, 🔍 Search is added.
You can also select a track by clicking it on the map.
Load an existing track
From a file #
Click 📁 Import and choose one or more files. Dragging the files onto the map is quicker when you have several.
| Format | Where it comes from |
|---|---|
| GPX | The universal format. Output from any GPS, watch or app. |
| FIT | The native format of Garmin watches and bike computers. It imports directly, with no conversion. |
| TCX | The older Garmin training format. |
| KML / KMZ | Google Earth and Google My Maps. Lines become tracks, points become markers. |
| JSON | A 🗂️ My workspace backup. |
Each loaded track gets its own colour in the list. If the file contains a track name, the editor uses it. If it states the sport (as Garmin and Strava do), the editor uses that too.
What happens on import
- A GPX file can contain several tracks: they appear separately in the list.
- The file's markers (waypoints) are placed on the map.
- Breaks in a recording (watch paused, segments) are kept.
- If elevations are missing or obviously wrong, the editor recalculates them from the terrain model. If they are only doubtful (completely flat, for example), a banner offers 🏔 Correct: it's up to you.
Limits
- 40 MB per file at most. Above 15 MB, editing can slow down: consider simplifying.
- A truncated FIT file (watch switched off during recording) is imported as far as it can be read; the editor tells you how many points it recovered.
- Points with invalid coordinates are ignored, and the editor says so.
From a share link #
A GPX Edit Pro share link opens a page presenting the outing (map preview, distance, elevation gain). Its button loads the tracks and markers into your editor, with a "Shared view" banner. You can then edit and export them like your own: your changes do not alter the original link.
Is your work saved?
Yes, but only in the browser you are working in. Here is what is kept, where, and how to take your work elsewhere.
Automatic saving #
Every change is saved automatically in your browser. Close the tab, reopen the editor: your tracks, their colours, names and sports, and your markers come back, with a "Session restored" message.
What it doesn't do
- Nothing is sent to a server. On another computer, a phone or another browser, you will find nothing.
- A private window keeps nothing once it is closed.
- Clearing the site's data (cookies and browsing data) erases the save.
- 🧹 Delete all also empties the save: that is intentional.
- Displayed POIs and photos are not kept.
"Automatic save unavailable" means the browser refuses to store anything (private window, storage full, strict privacy settings). Nothing is lost as long as the tab stays open: export your tracks or use 🗂️ My workspace.
🗂️ My workspace: save everything to a file #
My workspace saves the whole editor to a single file, and loads it again later, here or on another device. It is the right way to move from computer to phone, or to set a project aside.
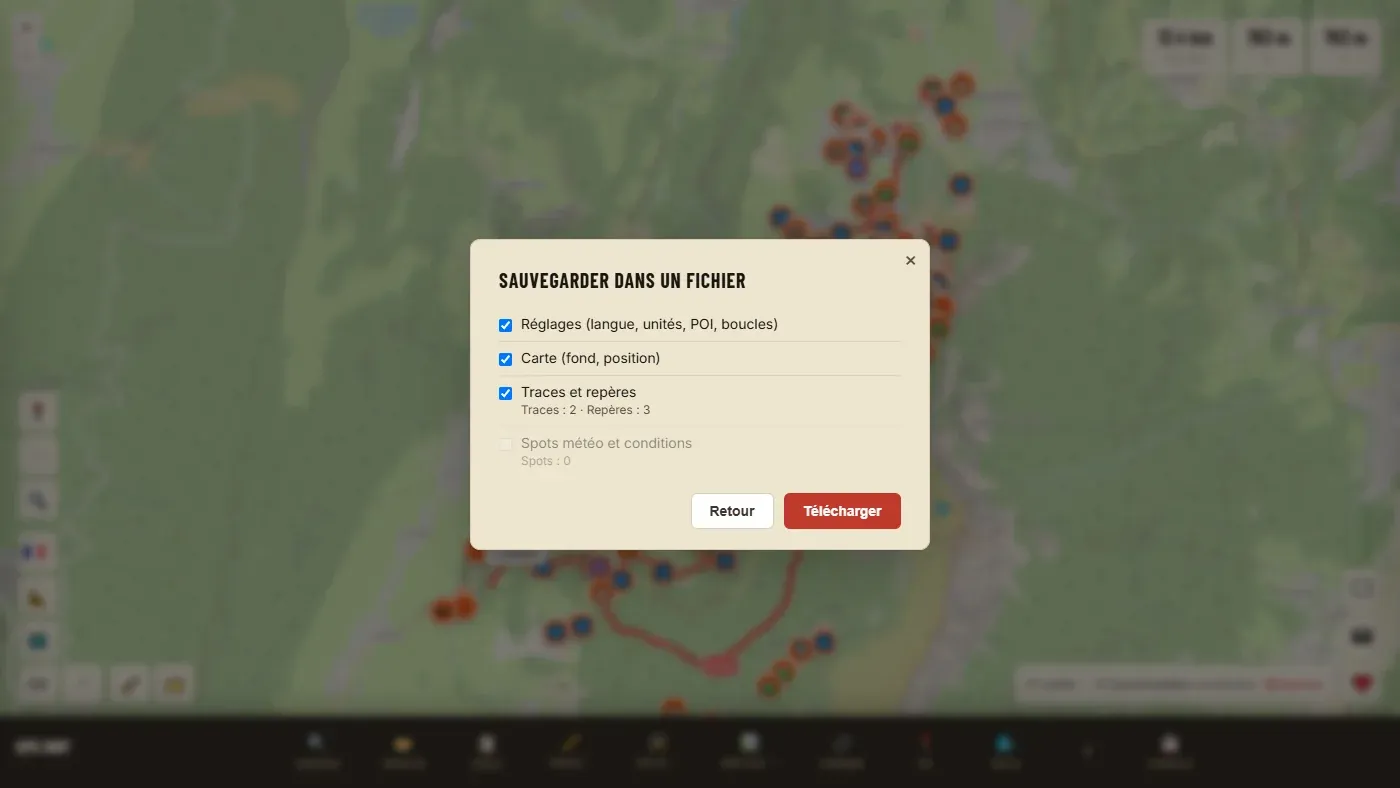
Save
- Click 🗂️, then 💾 Save to a file.
- Tick the sections to keep: Settings (language, units, POIs, loops), Map (base layer, position), Tracks and markers, Weather spots and conditions.
- Download: a
.jsonfile lands in your downloads.
Load again
- 🗂️ → 📂 Load a file… (or 📁 Import, or drag the file onto the map).
- A preview shows what the file contains. Choose Add to current tracks or Replace current tracks. For weather spots: merge or replace.
- Import. A replacement can be undone with ↶ Undo.
Good to know
- The file keeps all the point detail (times, heart rate, watch extensions).
- 100 MB at most. Photos are not included.
- Language, units and POI settings apply when the page reloads.
- Only GPX Edit Pro can read this file. For a GPS or another app, use 💾 Export.
Create a track
✏️ Draw offers three ways of working, depending on what you are after.
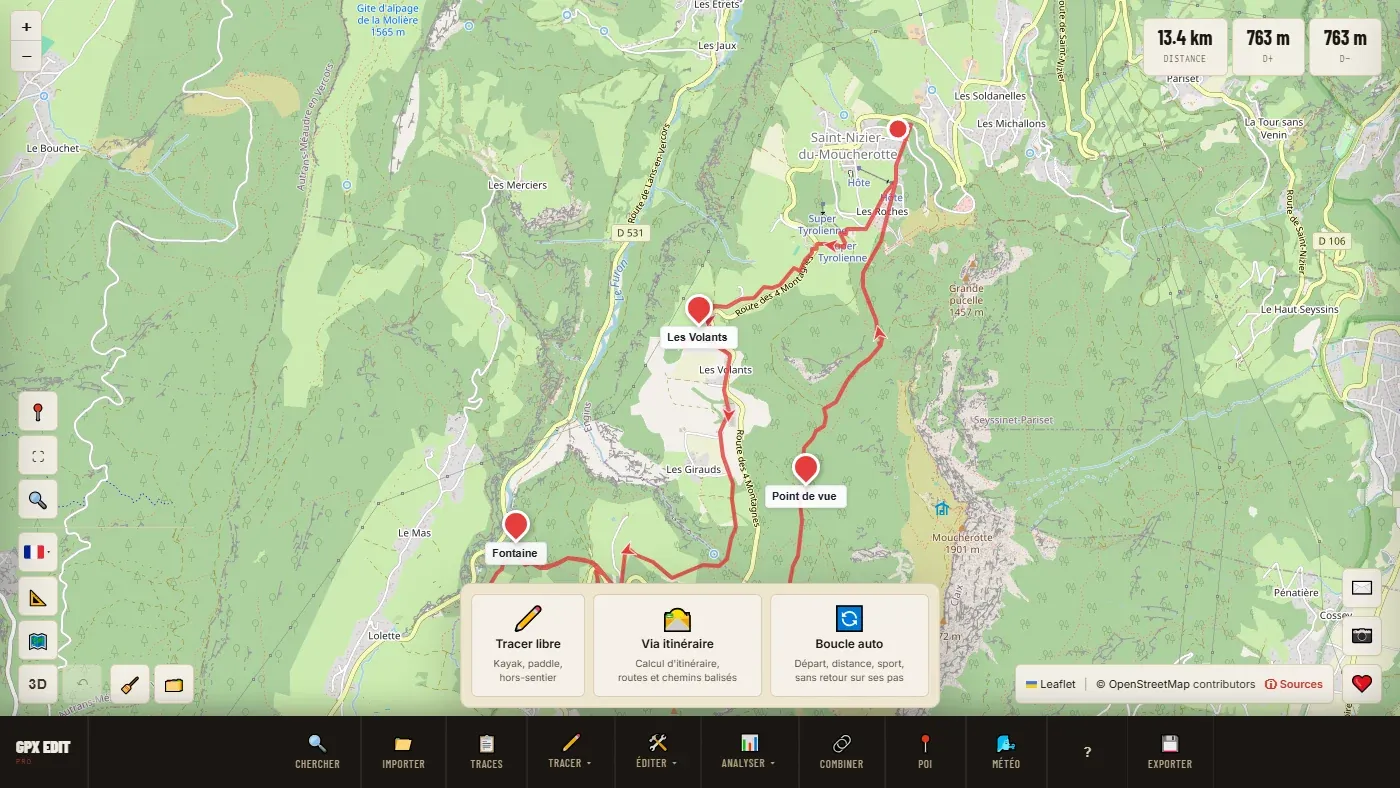
🛣️ Via routing: following paths #
The mode that suits nine times out of ten. You place points, and the tool finds the way between them along mapped roads and paths.
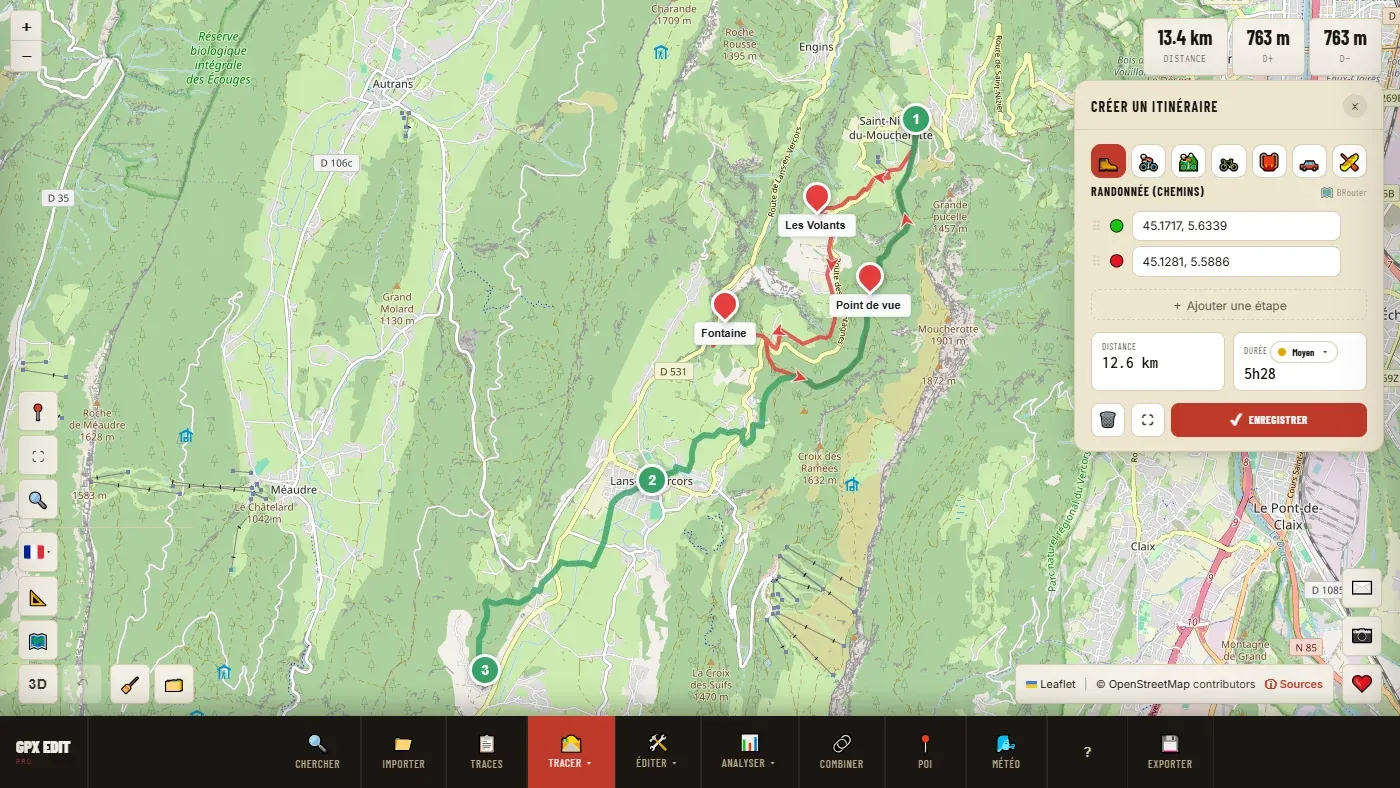
Step by step
- Choose the profile in the row of icons (the name of the active profile appears below).
- Click the map: the first point is the start 🟢, the last one the finish 🔴, the others are waypoints 🔵. You can also type a place name in a field of the list and pick it from the suggestions.
- Wait for each leg to appear before placing the next point.
- Check the distance and the estimated duration, then ✔ Save.
The seven profiles
| Profile | What it uses |
|---|---|
| 🥾 Hiking (paths) | Trails and paths, including in the mountains. The profile for walking and running. |
| 🚴 Road cycling | Paved roads, avoiding traffic when possible. |
| 🚵 MTB (trails) | Single tracks and technical trails. |
| 🚗 Car | Road network. Mainly useful for a shuttle or an approach. |
| 🚲 Gravel | Dirt roads and small roads, between road cycling and MTB. |
| 🎒 Bikepacking | Compromise between road and rolling paths, for a loaded bike. |
| 🛶 Waterway | Rivers, canals and navigable channels. See River and seashore. |
The window's controls
| ⠿ in the list | Drag to change the order of the points. |
| × at the end of a point | Removes this point (from three points upwards). |
| + Add waypoint | Adds a field for an intermediate point. |
| Pace badge | Changes the pace used for the estimated duration. See Pace. |
| 🗑️ Clear | Removes all the points, after confirmation. |
| ⛶ Fit | Re-centres the map on the route. |
| ✔ Confirm | Creates the track. |
A badly placed point can be fixed by dragging it on the map: the route is recalculated on either side.
What it doesn't do
- Changing profile recalculates the whole route with the new profile. For a mixed route (road then trail), create two tracks, each with its own profile, then merge them.
- The calculation only knows the paths in OpenStreetMap. An unmapped trail does not exist for it: in that case, use Freehand for that section.
- The calculation is done by an online service (BRouter, or OSRM as a backup). Without a connection, nothing is calculated.
- "Unable to calculate route" or nothing appears
- The point is almost always too far from any mapped path (in the middle of a field, a lake). Move it a few dozen metres onto a visible path. Check the profile too: a mountain trail is not accessible to the Road cycling profile.
- "BRouter too slow — trying OSRM…"
- The main service is not responding; the tool switches to the backup service. The result may follow other paths. Try again a few minutes later if the route doesn't suit you.
- The route makes a big detour
- The profile avoids a section (traffic, surface, restriction). Add a waypoint on the path you want to take.
✏️ Freehand: drawing by hand #
For off-trail, kayaking, the beach, ski touring: anywhere the way you will follow does not exist on the map.
Step by step
- Each click adds a point; the points are joined by straight lines.
- A right-click on a point already placed removes the last point.
- Finish with ✓ Confirm in the bar at the bottom, or with a right-click on the map. ✕ Cancel abandons.
No calculation, no server: you decide the line. Elevations are added automatically from the terrain model when you save, since a drawn line has none.
🔄 Auto loop: the tool finds it for you #
You have a starting point and a distance in mind; the tool looks for a loop that never doubles back on itself.
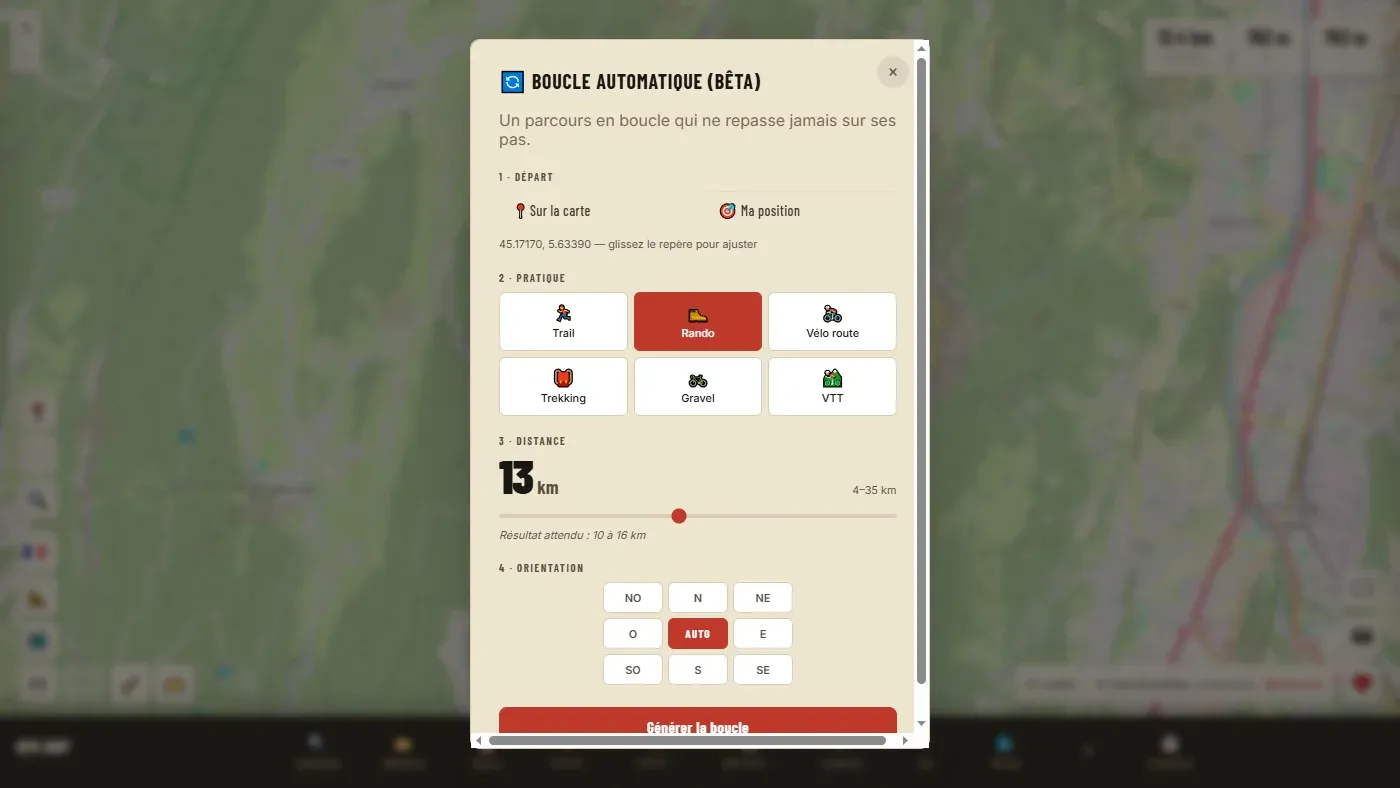
The settings
| 1 · Start | 📍 On the map (then click the start) or 🎯 My location. Drag the marker to adjust. |
| 2 · Activity | Trail running, Hiking, Road cycling, Trekking, Gravel or MTB. |
| 3 · Distance | The slider. The range offered depends on the activity, and the "Expected result" gives the realistic bracket. |
| 4 · Direction | AUTO, or a direction (N, NE, E…) if you want to head off on a particular side. |
Allow about a minute: the tool makes up to five attempts and keeps the best. If you don't like the result, Adjust and retry keeps your settings.
Limits
- Five generations per hour at most: each loop asks a volunteer-run server for about ten calculations. The number left is shown in the window.
- Good results come from areas rich in paths. Where there are few paths, generation can fail.
- "No loop of … without doubling back from this point"
- Try a shorter distance, move the start towards a denser path network, or set the direction back to AUTO. "Details of the 5 attempts" shows what went wrong (distance, doubling back, shape, closing).
- "The routing server is overloaded" or "has paused us"
- The routing service shares its time between all its users. Wait a few minutes before trying again.
Extending an existing track #
- Select the track (only one).
- ✏️ Draw → ✏️ Freehand. The tool asks: ✏️ New track or ➕ Extend this track.
- Choose Extend, then the side: ⬅️ From the start or ➡️ From the end.
- Click the continuation, then ✓ Confirm.
Only the added points receive an elevation from the terrain model. The altitudes of the original track are not affected: if they came from a barometer, they remain as they are.
Edit a track
All the functions in this chapter are in 🛠️ Edit and apply to the selected track. If a button is greyed out, no track is selected, or the function needs exactly one track, or at least two.
↶ Undo: the safety net #
↶ undoes the last operation on the tracks. The name of the operation ("Simplification", "Cut"…) appears next to the button before you click.
- The last twenty operations can be undone, one by one.
- If undoing would make a track disappear (undoing a cut, for example), the tool asks for confirmation.
- ↶ acts on tracks. Deleted markers do not come back with ↶.
- The history does not survive closing the tab: after a restored session, what was done before can no longer be undone.
✂️ Cutting a track #
Separating the outward leg from the return, removing a car approach recorded by mistake, splitting a long outing into two days.
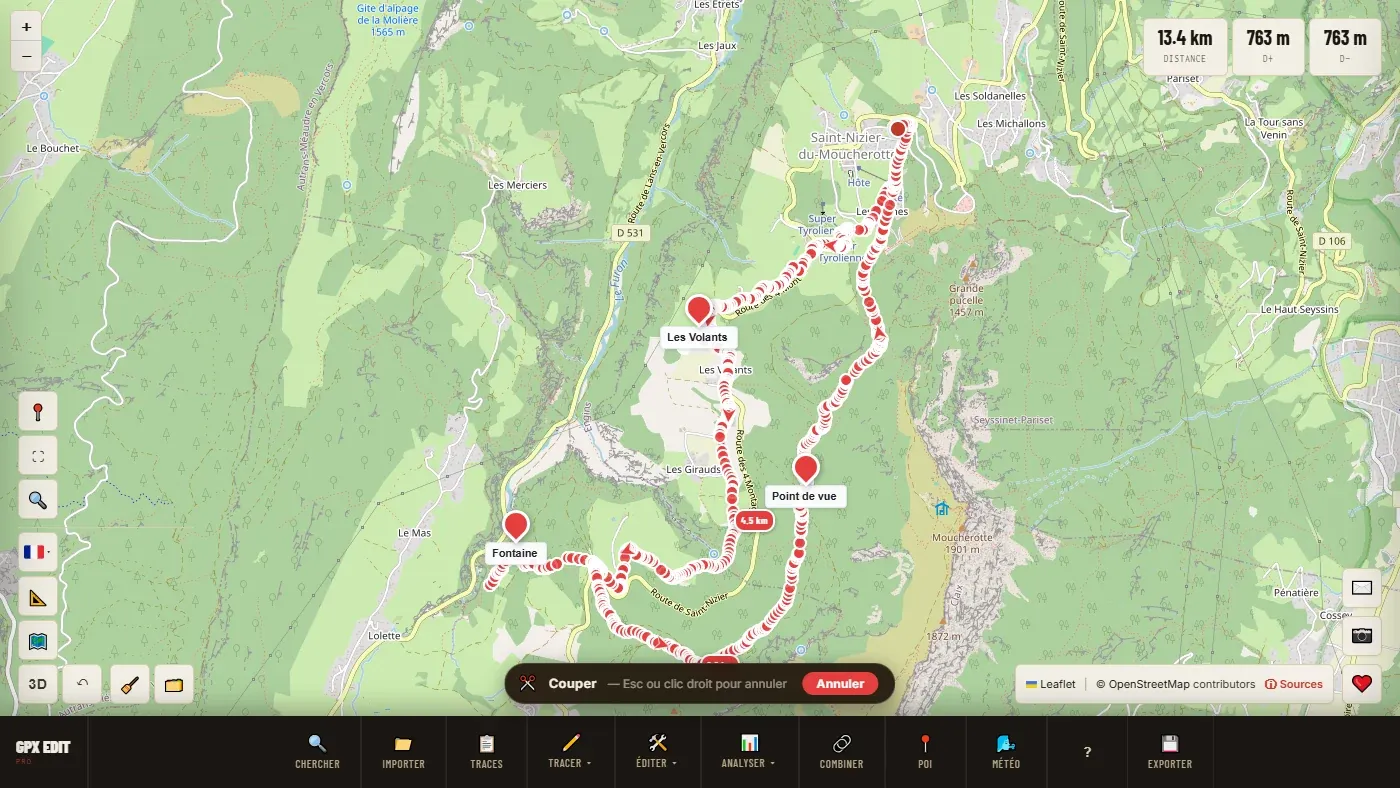
Three ways to cut
- ✂️ Cut: click the cutting point on the track. Esc or a right-click cancels.
- Right-click the track → ✂️ Cut here: the quickest if you can see the spot.
- From the elevation profile: click and drag on the profile to select a section, then ✂️ in the profile's column. You get up to three tracks: before, the section, after. Handy for isolating a climb.
The pieces become independent tracks in the list. After a cut at a point, they are named automatically after the places they pass through; after a cut from the profile, a window lets you choose the name and colour of each piece. To rename later: click the name in the list.
To keep only one section, cut twice (or use the selection on the profile), then delete the pieces you don't need.
You cannot cut at the first or last point. Undo: ↶.
🔗 Merging two or more tracks #
Joining an outing that the watch split in two, assembling stages prepared separately.
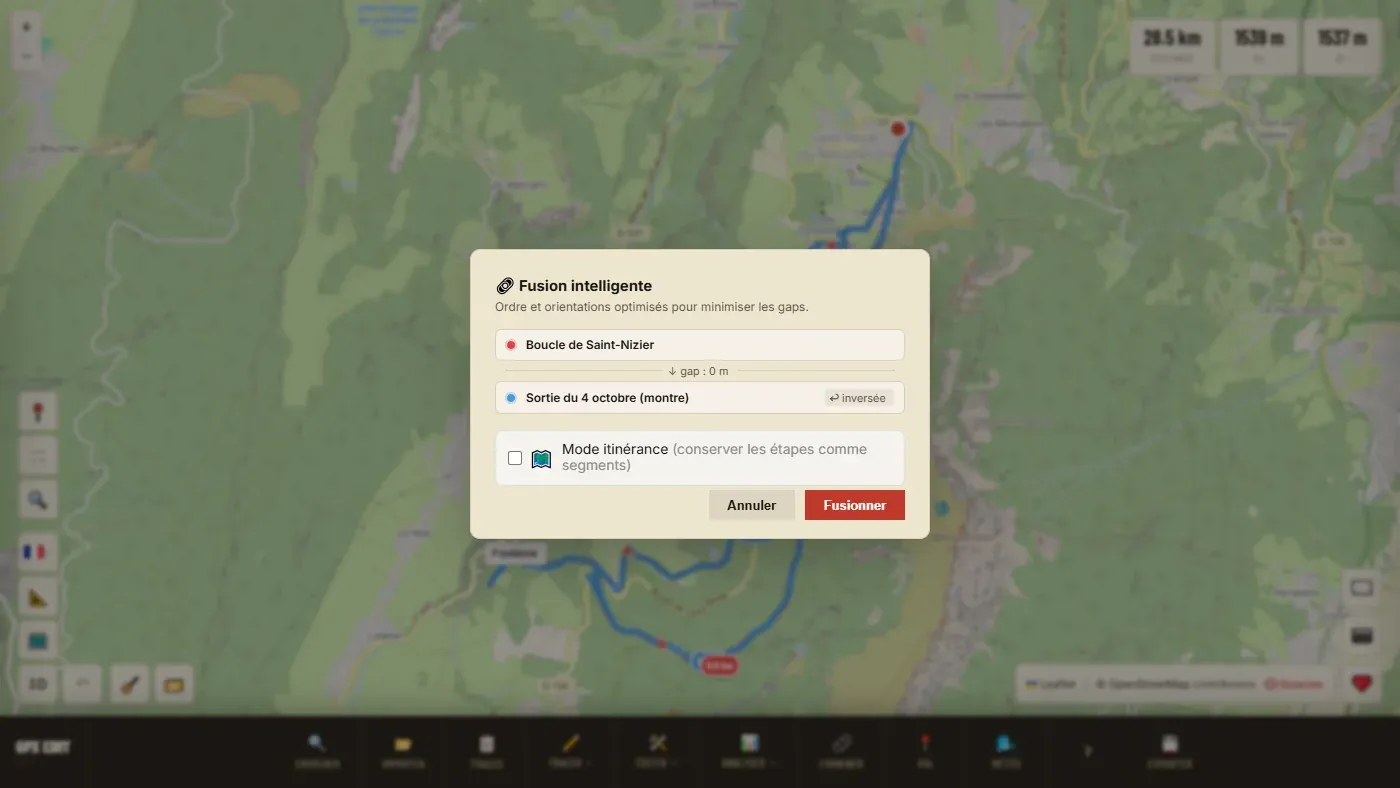
Step by step
- Select at least two tracks: ☑️ Multi-select, or Ctrl+click in the list.
- 🔗 Merge. The "Smart merge" preview chooses the order and direction of each track to reduce the gaps at the joins. A track turned round is marked "reversed".
- Check the gaps shown between the tracks, then Merge.
Itinerary mode
When ticked, it keeps each original track as a separate stage (a segment) in the merged file. That is what you need for a multi-day trip: a single file, but your GPS knows where stage 1 ends. When unticked, everything becomes one continuous track.
If the preview reports large gaps, the tracks do not touch: the merged track will have "jumps". Check the order, or fill the hole with Extend before merging.
Not to be confused with 🔗 Combine, which looks for a loop in a set of tracks.
↩️ Reversing the direction #
The start and the finish swap places. Useful when you have got hold of someone's track who walked or rode it the other way. The elevation follows: a route with 800 m of ascent and 200 m of descent becomes 200 m of ascent and 800 m of descent. Undo: ↶.
🔄 Loop: closing a track #
Bringing the finish back to the start. The classic case: the GPS switched off fifty metres before the car, or an outward leg for which you want the return.
A window shows the gap to fill and offers three ways to close it:
| 🛣️ Via BRouter | Calculates the return along paths, with the profile chosen in the list. |
| 📏 Straight line | Joins the finish directly to the start. |
| ✏️ Freehand | You draw the return yourself, point by point. |
If the finish is already less than 100 m from the start, the tool considers the track a loop. Undo: ↶.
🏁 Moving the start #
Made for loops. Your loop starts from a car park, but you set off from the next village, which is on the route: turn on the function and click the new start on the track. The line does not change; only the starting point moves round the loop. Undo: ↶.
📉 Simplify: lightening a file that is too heavy #
Watches record one point per second: a five-hour outing makes 18,000 points. Many GPS units refuse such a heavy file, or struggle with it. Simplify removes the points that add nothing to the shape of the line.
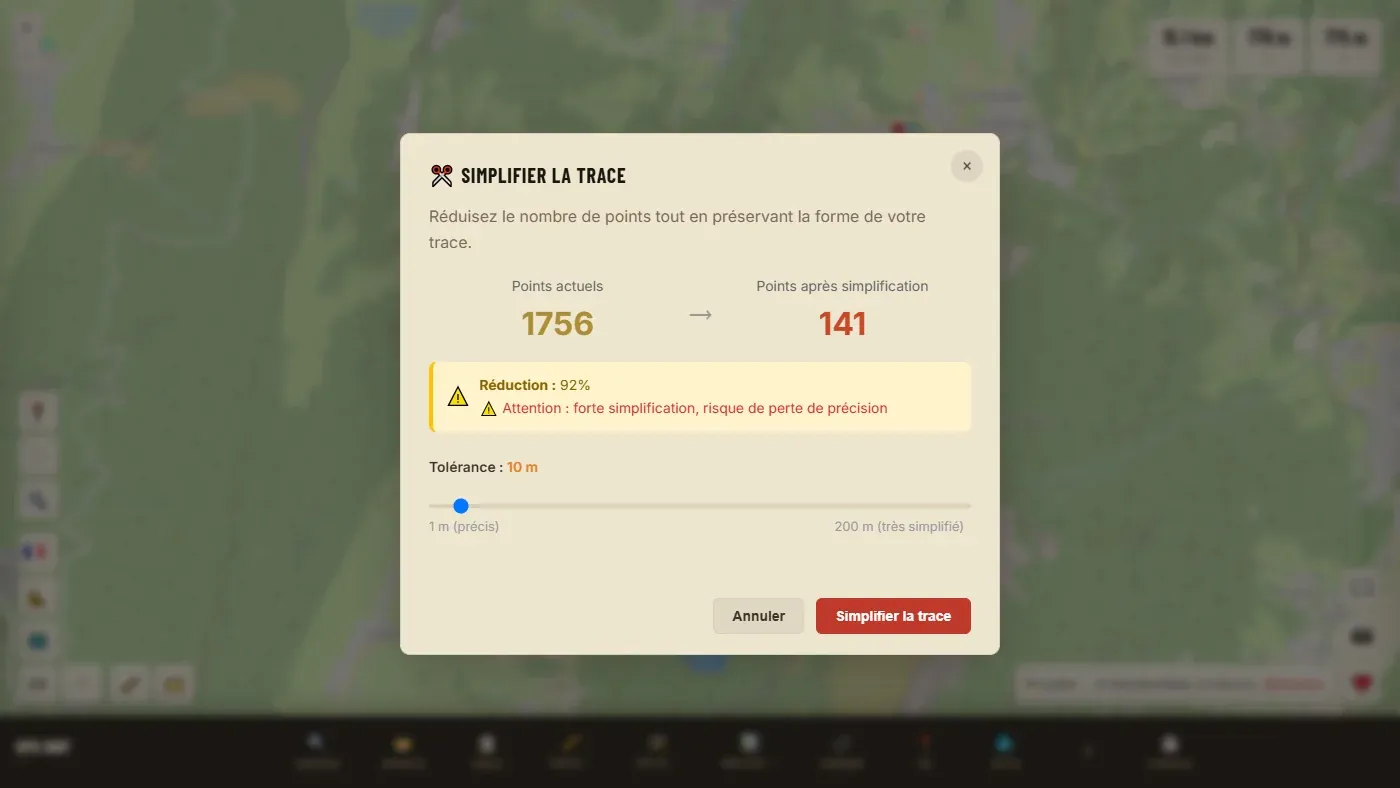
The setting: tolerance
From 1 m to 200 m, 20 m by default. A tolerance of 10 m means: "remove any point that is less than 10 metres from the line its neighbours would form".
| Tolerance | Effect |
|---|---|
| 1 to 5 m | Light thinning. The line looks the same. |
| 10 to 20 m | The right compromise for a watch track. |
| 50 m and more | Hairpins and bends start to be cut. Reserve this for long flat routes. |
It appears as soon as more than 70% of the points are removed. On a watch track this is almost always the case, and it is not a problem in itself: check on the map that the shape of the line stays faithful. If the bends are cut off, lower the tolerance.
What it changes
- Fewer points means fewer micro-variations in elevation: the ascent drops a little, and is often more accurate. If your ascent collapses, you have gone too far: ↶ and start again more gently.
- The points kept retain their time, elevation and data.
Undo: ↶.
✨ Clean up: GPS spikes, stops and small defects #
A recorded track often has defects: a point that jumped 200 m away under the trees, a cloud of points during the picnic break that inflates the distance, duplicate points. Clean up finds them, shows you what it intends to remove, and touches nothing until you confirm.
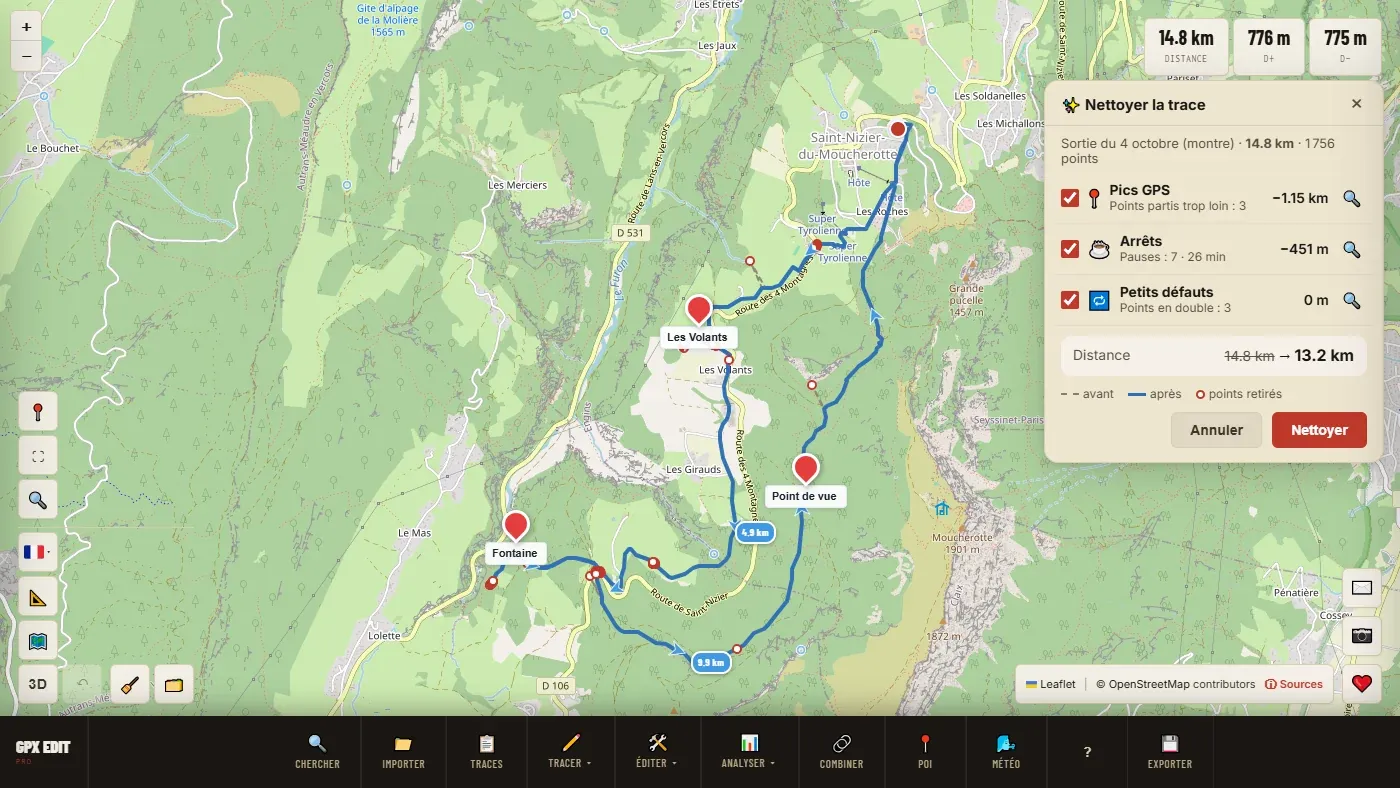
The three corrections, each with its own tick box
| Row | What it removes |
|---|---|
| 📍 GPS spikes | One to three points that went far away and came back: the GPS "jumped". With a timestamped track, also the first points at the start (GPS not yet settled) or at the finish if they are far from the rest. |
| ☕ Stops | The points that wander on the spot during a break. Each stop is replaced by two points in the same place (arrival and departure): the length of the break is kept. Requires a timestamped track. |
| 🔁 Small defects | Duplicate points (same position, same time) and an isolated point whose time goes backwards. |
Step by step
- Select a single track, then ✨ Clean up.
- Read the panel: each row says how many it found and how much it takes off the distance.
- Click 🔍 at the end of a row to look at it on the map; each click moves to the next place.
- Untick what you want to keep. The "before → after" distance updates.
- Clean up applies. Cancel (or Esc) closes without changing anything.
What it doesn't do
- Elevation is not touched: that is the job of 🏔️ Correct elevation.
- Nothing crosses a break in the recording: segments stay separate.
- A break that is too short (under a minute, or one that makes almost no difference to the distance) is left as it is.
- On a drawn or calculated track, there is usually nothing to clean: the panel shows "Nothing to clean ✓".
To undo afterwards: ↶.
🏔️ Correcting the elevation #
You load your outing and the ascent says 1,400 m when you know you did 900. It is almost always the watch's barometer: it measures pressure, and pressure changes with the weather over the course of the day. Over four hours, the error builds up.
Step by step
- Select the track and click 🏔️ Correct elevation. With several tracks loaded, a window lets you tick the ones to correct.
- A progress bar appears: a few seconds to a minute depending on the length.
- A message tells you how many elevations were corrected and from which source.
What the correction does
The tool compares your profile with a terrain model and corrects your sensor's slow drift. It does not replace everything: your barometer picks up details the terrain model cannot see, and keeping them gives a more accurate ascent. Points without an elevation take the model's.
| Area | Terrain model used |
|---|---|
| France | IGN RGE ALTI, very precise (about a 7 m grid). |
| Elsewhere | Copernicus GLO-90, worldwide, less precise (90 m grid). |
- The elevation gain barely changes
- Your track probably had no barometric elevation: a drawn or calculated track already takes its elevation from the terrain model. There is nothing to correct.
- "Elevation service unavailable"
- The terrain model data could not be loaded (connection lost, company network blocking it). Try again later.
- My ascent doesn't match Strava or Garmin Connect
- Each service calculates the ascent in its own way (smoothing, different terrain model). Differences of a few per cent are normal. A huge difference comes from barometer drift: correct the elevation.
Undo: ↶ restores the previous elevations.
📏 Split by interval #
Cuts a track into regular sections, each becoming a separate track: the stages of a trip, training intervals.
| Distance | Length of each section (1 km by default). |
| Time | Duration of each section in minutes (30 by default). Only for a timestamped track: the window shows whether the times were found. |
If the track is shorter than the interval, nothing is split. Undo: ↶.
For a hike, a trail run or a race that needs marking, split the course into sections of 5 or 10 km: each section becomes a separate track, in a different colour, named "Course - 1", "Course - 2"… Export with Separate files and send each volunteer marking the course their section, to load into their GPS or phone. For uneven sections (from one feed station or junction to the next), cut by hand instead with ✂️ Cut.
⚙️ Reshape #
Realigning a track that runs beside the real path: a GPS that drifted under the trees, an old track on a trail that has been rerouted.
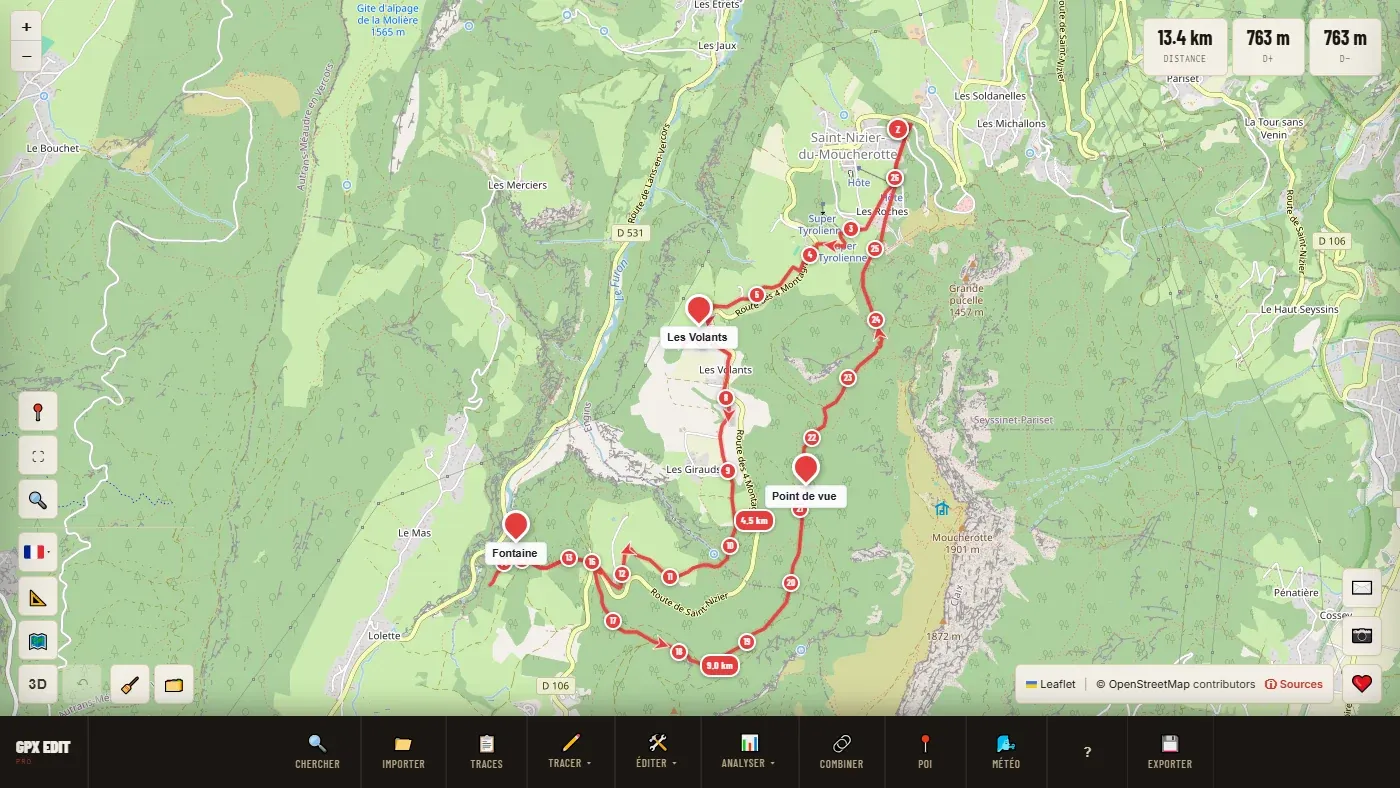
- Select a single track, then ⚙️ Reshape.
- Drag a beacon: the neighbouring points follow smoothly.
- In the editing panel, "Beacon spacing" sets their density: Auto, or the slider (close together for precise work, far apart for an overall movement).
- ✔ Confirm applies and recalculates the elevation; ✕ Cancel abandons.
This function does not exist on phones: it needs a precision a finger cannot give.
📌 Edit points #
Point-by-point adjustment. Every point of the track can be grabbed:
| Drag a point | Moves it. |
| Click a point | Shows and edits its elevation. |
| Right-click a point | Deletes it. |
The bar at the top counts the points. ✔ Confirm keeps your changes, Cancel abandons them. To delete a single point without entering this mode: right-click the track → ✖️ Delete this point.
📍 Placing a marker #
Marking a point that is not necessarily on the track: the car park, a spring, the place to turn off. Markers go with the exported file and are displayed on most GPS units.
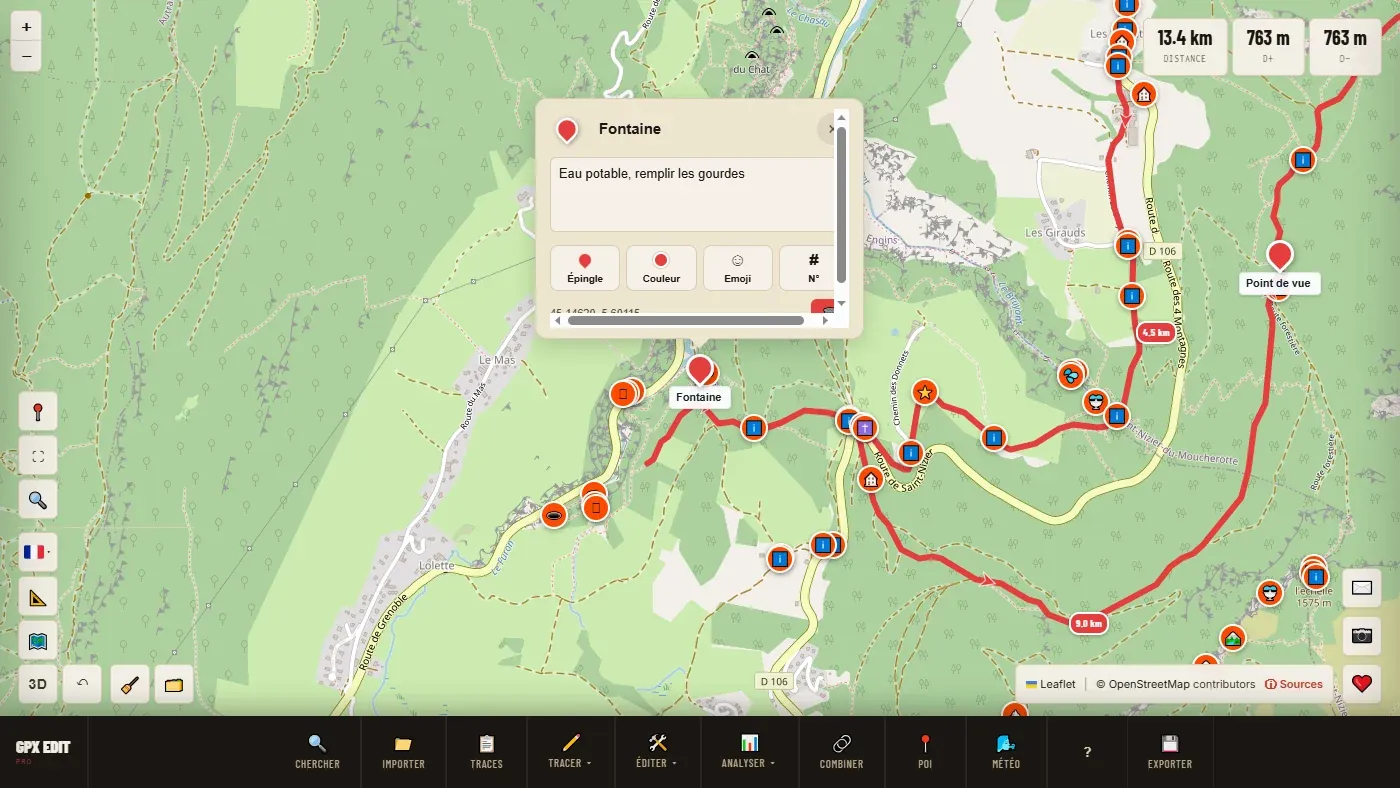
| Name and Description | What will be shown on your GPS. |
| Type | Pin or round. |
| Colour | A colour from the palette or your own. |
| Emoji | One icon per category: overnight, water and food, route, transport, services, nature. Common icons (summit, water…) are converted into symbols that GPS units recognise. |
| No. | Numbers the markers in the order the track reaches them. Useful for a roadbook. |
| 🗑️ | Deletes the marker. |
A marker is moved by dragging it. Markers also serve as points for the route card. From a POI, "📌 Save as marker" creates one in one click.
🗑️ Delete, and multi-select #
- 🗑️ Delete (Del) removes the selected tracks, after confirmation. ↶ brings them back.
- 🧹 Delete all empties the workspace: tracks, markers and POIs. ↶ brings back the tracks, not the markers.
- ☑️ Multi-select: each click adds a track to the selection or removes it, without deselecting the others. Needed to merge or compare. Ctrl+click does the same without turning the mode on.
- ✓ Select all (Ctrl+A) ticks all the visible tracks.
When several tracks are selected, the order of selection is shown (1., 2.…): it is the order proposed for a merge.
Analyze a track
This chapter answers a single question, asked in several ways: what am I letting myself in for? All these functions are in 📊 Analyze and do not change the track.
📊 Elevation profile #
The relief of the route, kilometre by kilometre, with the distance, the ascent, the descent and the maximum elevation.
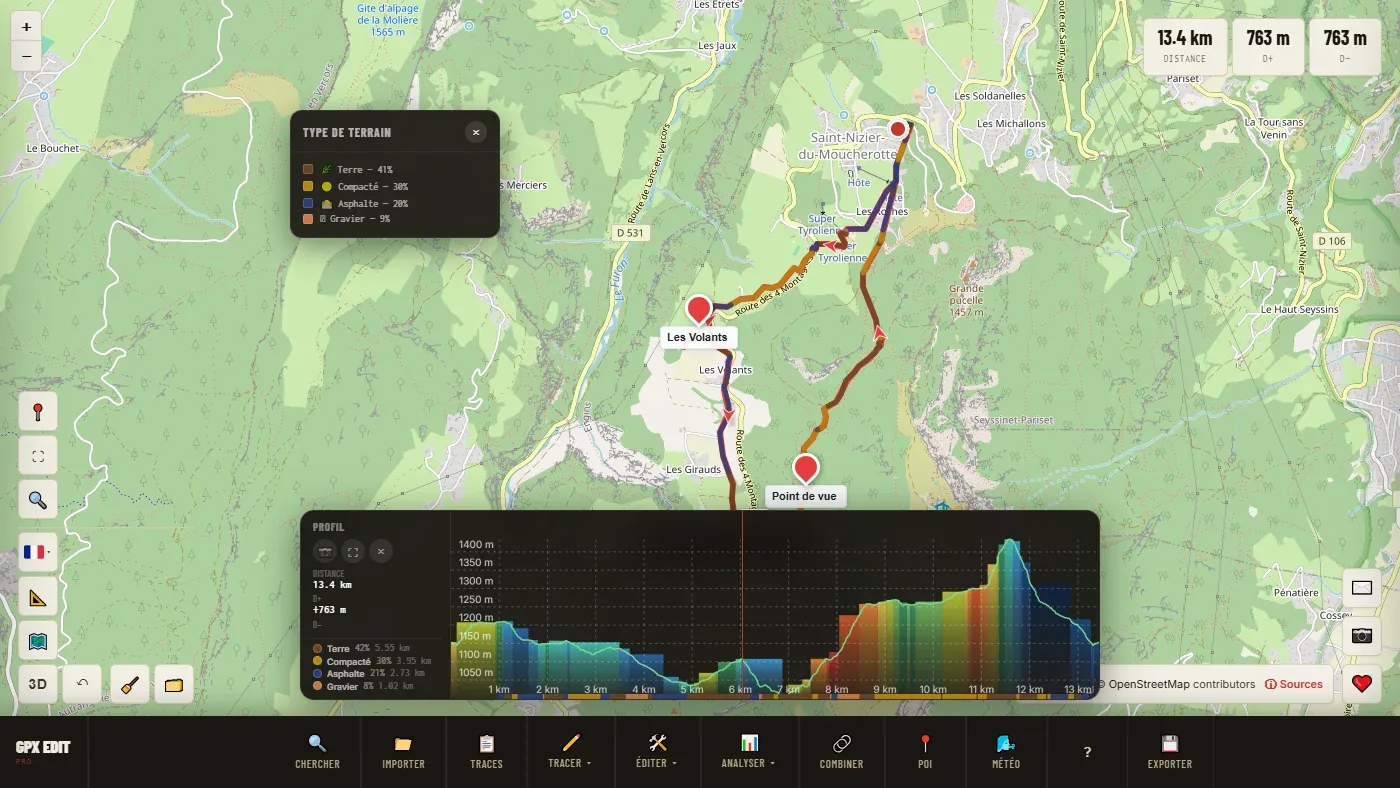
What you can do on it
| Hover with the mouse | A cursor moves at the same time on the map: "the big bump in the middle is the pass before the village". |
| Click and drag | Selects a section and shows its figures: from km X to km Y, length, ascent, descent and maximum gradient. ↺ clears the selection. |
| ✂️ | Cuts the track at the ends of the selection. See Cut. |
| 📷 | Saves the profile as a PNG image. |
| ⛶ | Shows the profile full size, with the surface band and a wider PNG export. |
| Panel edges | Drag them to enlarge it. Ctrl+R puts it back in place. |
The profile shows the selected track. With several tracks selected, select the one you are interested in before opening it.
🎨 Slope by color #
The profile says there are 900 m of ascent. Slope by color tells you whether it comes in one brutal ramp or spread over twenty kilometres. It is not the same outing.
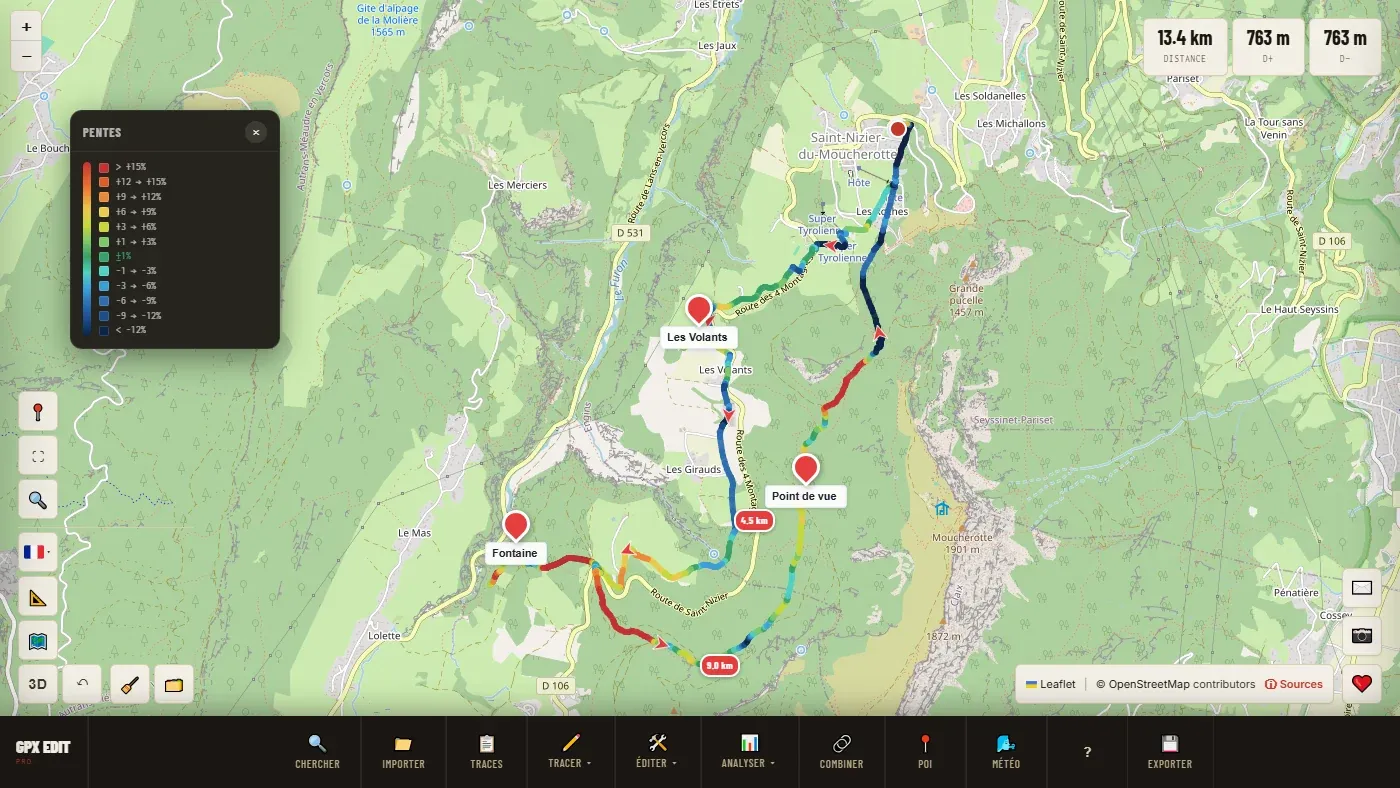
All visible tracks are recoloured. A second click returns to the normal colours. Hovering over a section shows a bubble with its gradient, elevation change and length. Not applicable to a kayak track.
🌍 Surface by color #
What you will ride or walk on: asphalt, paved, compacted, gravel, dirt, grass, rock, sand. Decisive for gravel riding, where tyre choice depends on the share of unpaved track.
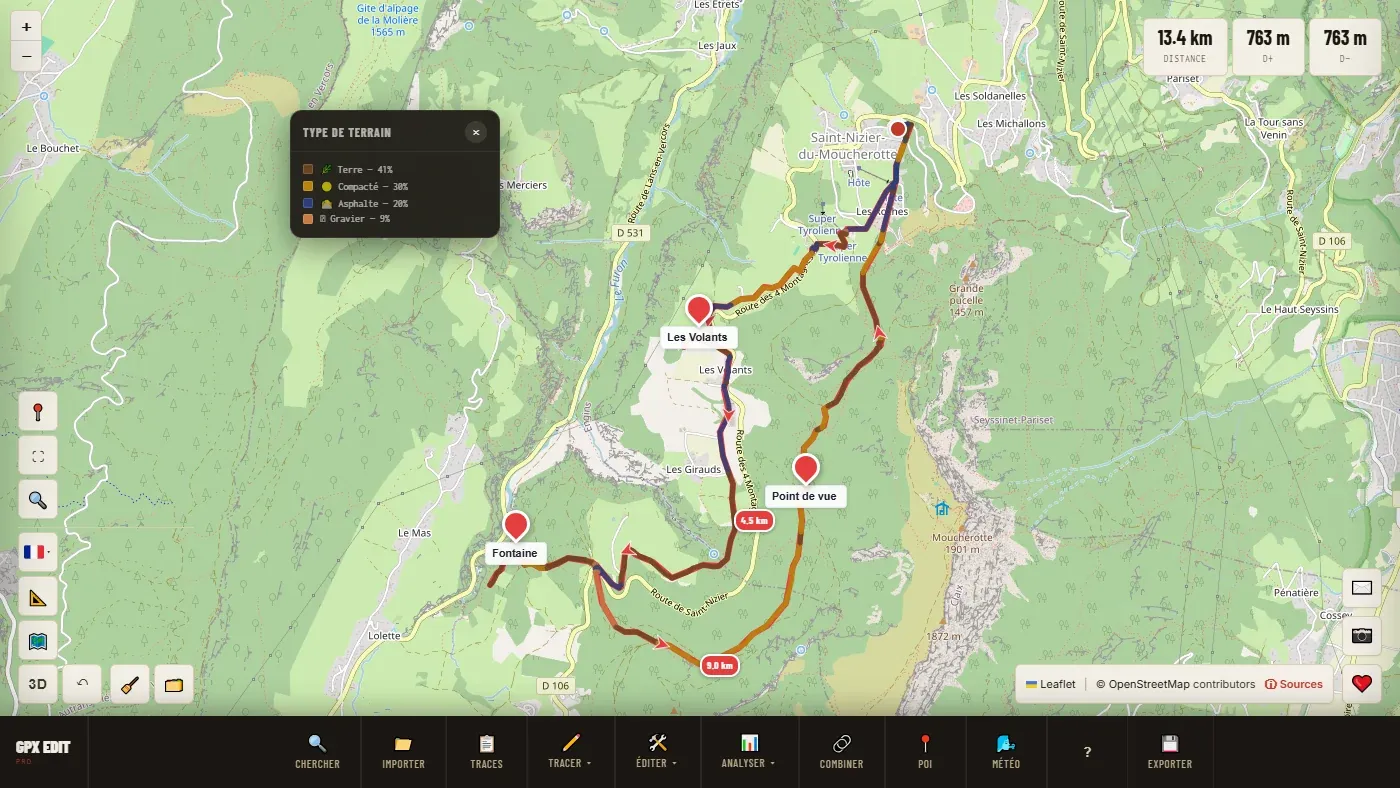
The tool reads the surface recorded in OpenStreetMap along the whole route. The first time, an analysis of a few seconds runs on all the loaded tracks; after that, the display is immediate.
As with any collaborative data, coverage varies. A path with no surface recorded appears as "Unmapped": it does not mean it is bad, only that nobody has described it. If the region is not covered, the tool shows "Zone not covered".
☀️ Sunlight #
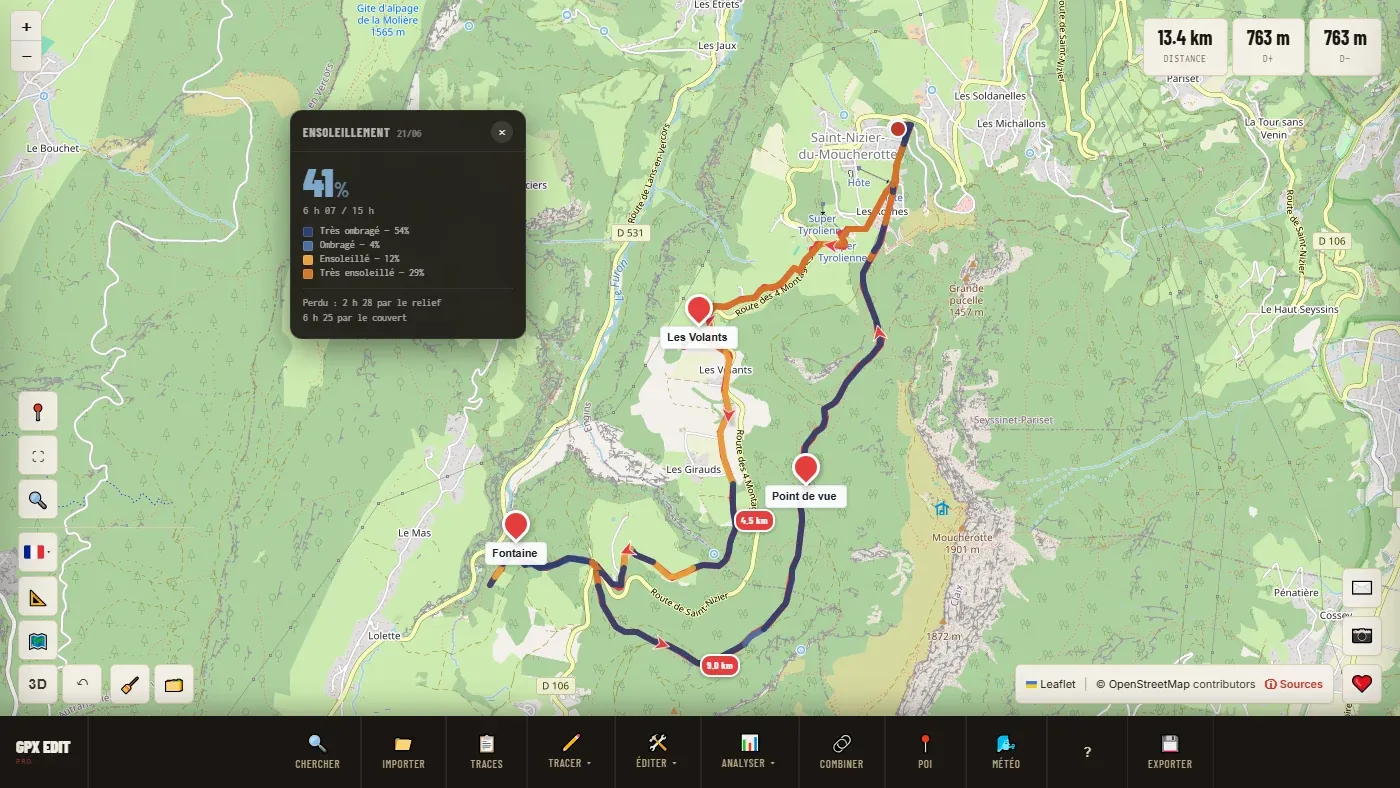
Which sections will be in shade or in the sun, taking the relief and the forests into account. In summer on a long exposed climb, or in winter in a deep valley, it changes the outing.
Step by step
- Select the track, open ☀️ Sunlight.
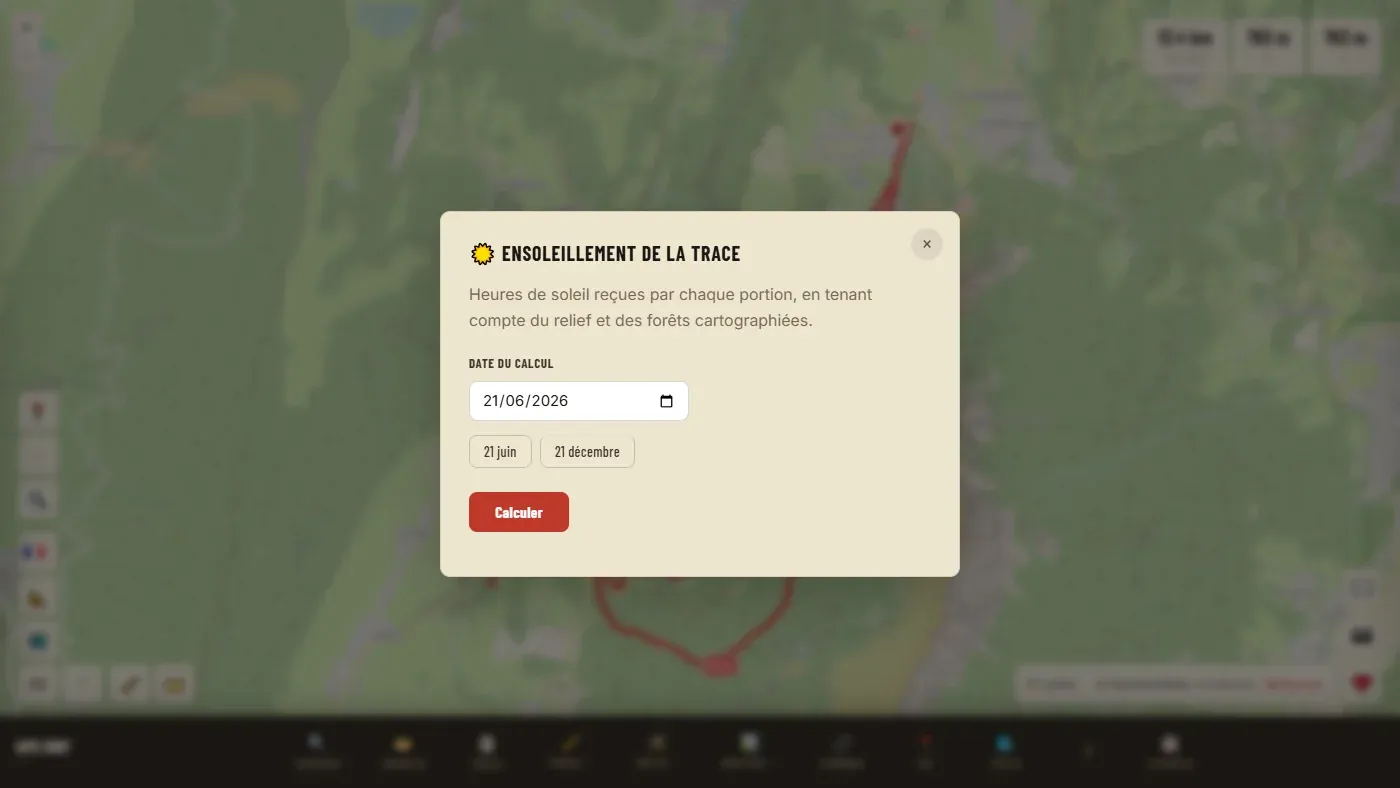
- Choose the date (shortcuts 21 June and 21 December), then Calculate.
- A progress bar details the stages: relief, forests, path of the sun. Allow anything from a few seconds to several tens of seconds in the mountains.
Reading the result
The track goes from "Deep shade" to "Full sun". The panel gives the share of the route in the sun, the hours of sunshine received over the day, and what was lost to the relief and to the tree cover. On a wooded route, it is often the trees that block the most sun.
- "No woodland data for this area — terrain only"
- The forests are not known here: the calculation only takes the relief into account, and so overestimates the sun in the woods.
- "No terrain data here"
- The terrain model needed for the calculation is not available for this area.
🕑 Route card #
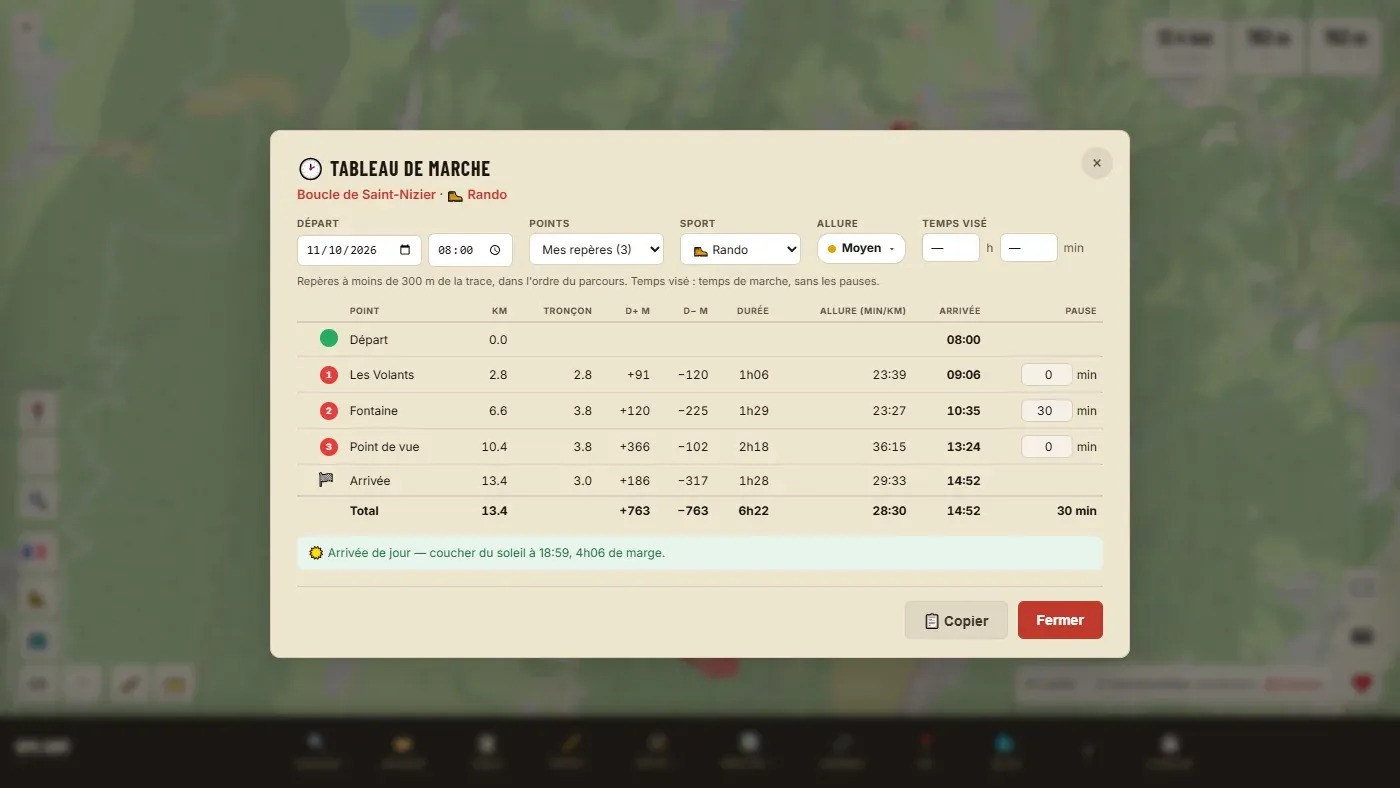
The time you will pass each point of the route: your markers, or every X km. With breaks, the arrival time, and a warning if you will arrive after dark.
The settings
| Start | Start date and time (8:00 by default). |
| Points | My markers: the markers within 300 m of the track, in route order. Or Every 1, 2, 5 or 10 km. With no marker on the track, the table splits by distance. |
| Sport | Changes how durations are calculated. See Sport, pace and durations. |
| Pace | From Relaxed to All-out, or My pace… to enter your own. |
| Target time | Your target moving time (without breaks). The table becomes a pacing plan: it spreads that time according to the relief of each section. |
| Break | In the last column, a break duration for each point. It shifts all the following times. |
The columns: point, kilometre, length of the leg, ascent and descent, duration, pace (min/km on foot) or speed (by bike), arrival time, break. At the bottom, the total and a line about the sun.
📋 Copy copies the table: paste it into a spreadsheet. The route card is also included in the PDF map.
Your settings (start, points, breaks, target time) are kept with the track.
📊 Compare tracks #
Deciding between two variants of the same route, or measuring the difference between what was planned and what was done.
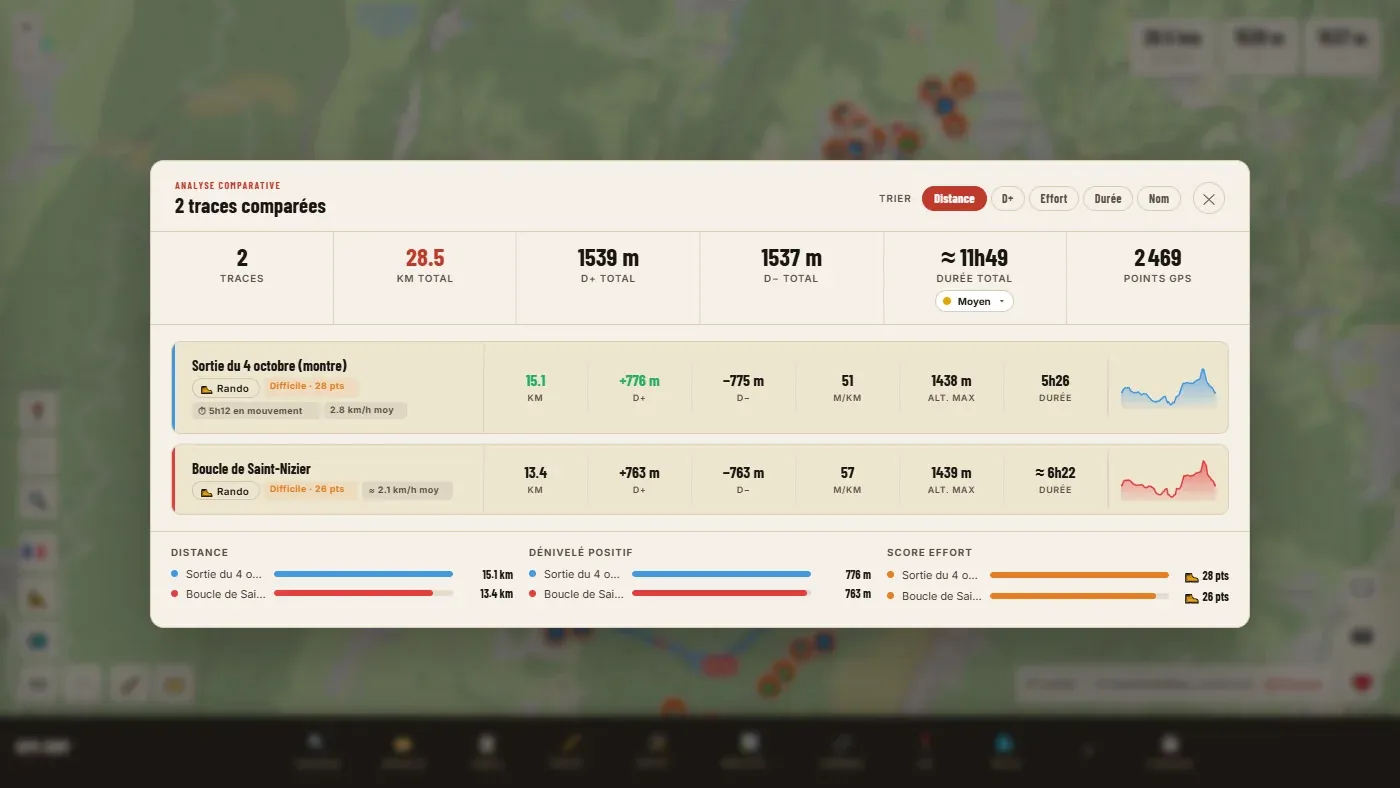
Each card gives distance, ascent, descent, maximum elevation, duration, number of points, a mini-profile and an effort score translated into a level (Easy, Moderate, Hard, Very hard). The duration is the real duration for a recorded outing, an estimate otherwise (marked ≈). The "Sort" buttons order the cards by distance, ascent, effort, duration or name. Each track's sport can be changed on its card.
The effort score compares tracks of the same sport: it means nothing between a hike and a bike ride. It does not exist for kayaking and paddleboarding.
🎮 Simulate an activity #
Turns a drawn route into a "recorded" outing: each point gets a time, with simulated heart rate and cadence. Some software requires this, notably the kind that overlays data on a video.
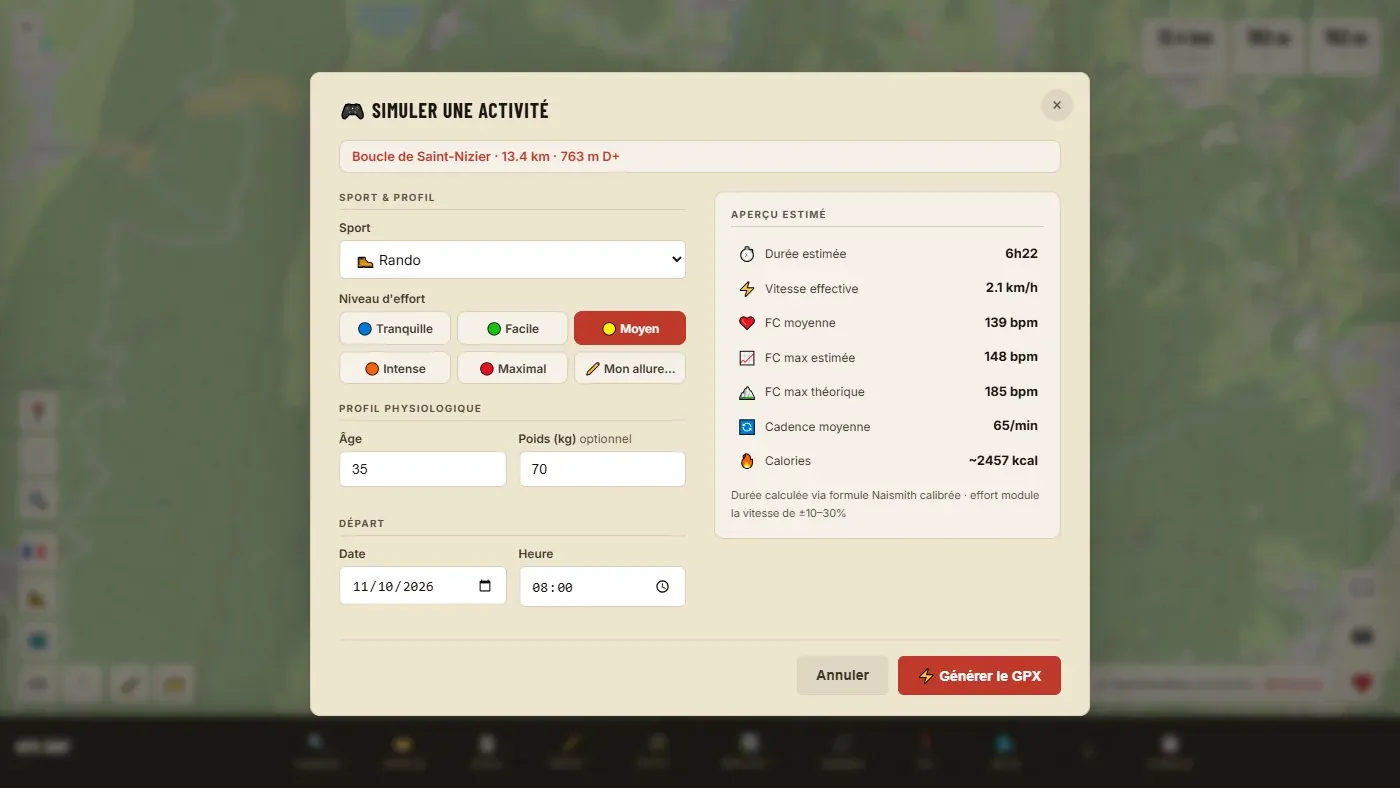
| Sport | The editor's seven sports. |
| Effort level | Relaxed, Easy, Medium, Hard, All-out, or My pace… |
| Age | From 15 to 80. Used for heart rate. |
| Weight | Optional. Used for calories. |
| Start | Date and time of the first point. |
The preview gives the estimated duration, speed, average and maximum heart rate, cadence and calories. Generate GPX adds a new timestamped track (same line) and immediately downloads its GPX file.
Set the start date and time to those of your video recording: the exact time is what lets the two synchronise.
Sport, pace and durations
A track's sport and the chosen pace set every duration the editor shows: the route window, the comparison, the route card, the PDF map, the share page. It is the question that comes up most often: "where does this duration come from?".
A track's sport #
Seven sports: 🥾 Hiking, 🏃 Trail running, 🚴 Road cycling, 🚲 Gravel, 🚵 MTB, 🛶 Kayak, 🏄 Paddleboard.
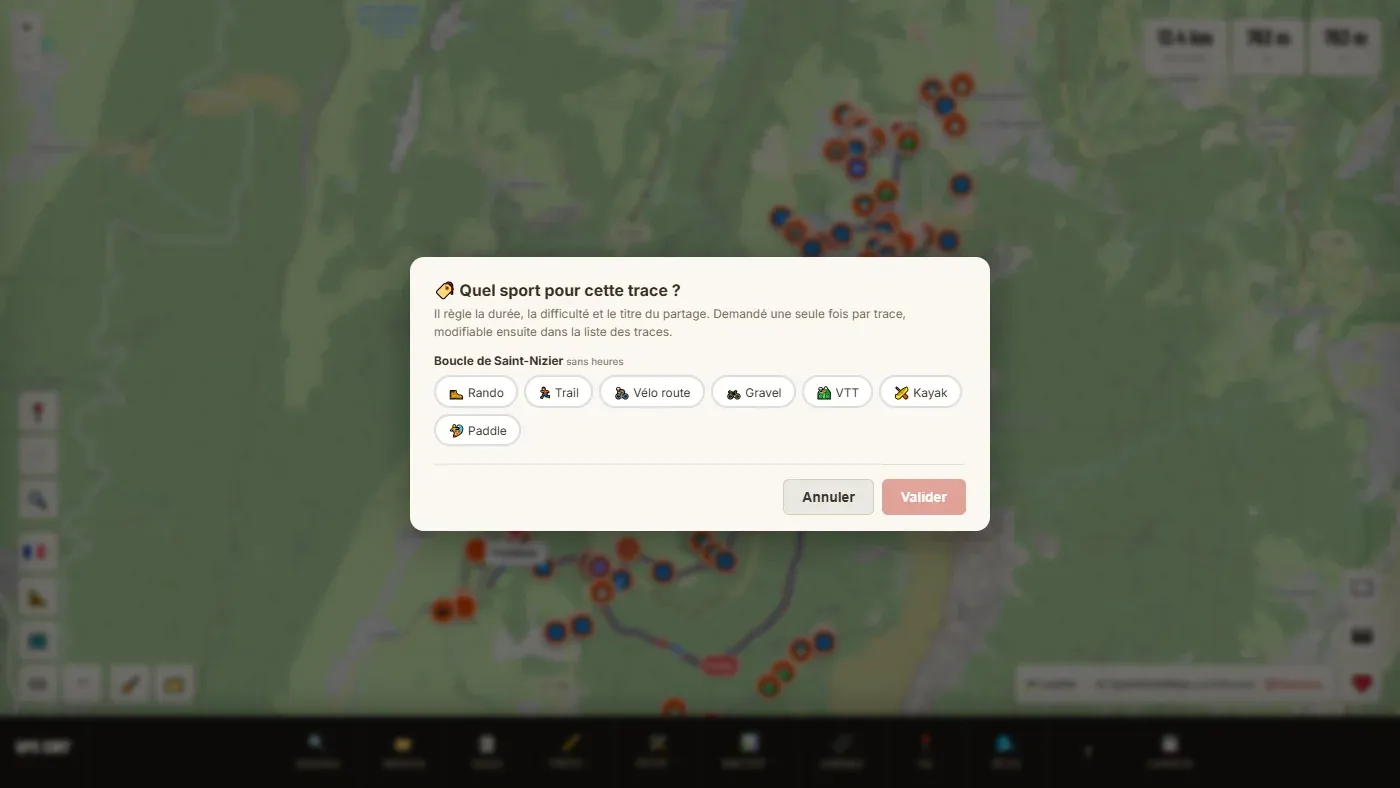
- When it is asked. Not on import: when a tool needs it (route card, PDF map, sharing…). Only once per track.
- Suggestion. For a recorded outing (with times), the editor suggests a sport based on the speed. For a track without times, nothing is ticked: it is up to you to choose.
- If the file says so. A GPX from Garmin or Strava that states the sport passes it on: the question is not asked.
- Changing it. Click the sport icon (or the ?) on the track's row in 📋 Tracks.
Pace #
A "Pace" badge (Medium by default) appears wherever a duration is estimated. Click it to change it: the setting applies to the whole editor and is remembered in your browser.
| Pace | Effect on speed (hiking) |
|---|---|
| Relaxed | about 28% slower than Medium |
| Easy | about 15% slower |
| Medium | the reference |
| Hard | about 15% faster |
| All-out | about 30% faster |
| My pace… | Your own moving average, in min/km or km/h, breaks not counted. |
The differences are wider on foot than by bike or on the water.
How the duration is calculated #
For a track without times (drawn, calculated), the duration is estimated: the distance divided by a base speed, plus some time for each climb. Here are the values at Medium pace, excluding breaks:
| Sport | Base speed | Time added for elevation |
|---|---|---|
| 🥾 Hiking | 3.5 km/h | 1 h per 300 m of ascent |
| 🏃 Trail running | 6 km/h | 1 h per 600 m of ascent |
| 🚴 Road cycling | 22 km/h | 5 min per 1,000 m of ascent |
| 🚲 Gravel | 18.5 km/h | 12 min per 1,000 m of ascent |
| 🚵 MTB | 12.8 km/h | 7.5 min per 1,000 m of ascent, and 4 min per 1,000 m of descent |
| 🛶 Kayak | 5.5 km/h | none |
| 🏄 Paddleboard | 3 km/h | none |
Example: a 13.4 km hike with 763 m of ascent gives 13.4 ÷ 3.5 + 763 ÷ 300, or about 6 h 20 min of walking.
For a recorded outing (with times), the editor shows its real time, and the "moving" time (stops and breaks with the watch paused do not count). If the recorded speed is implausible for the chosen sport (more than two and a half times the base speed), it falls back on the estimate.
With My pace, the duration is simply the distance divided by your speed: the elevation is assumed to be already included in your average.
Points of interest
Finding what you will need along the way: water, a bakery, a shelter, a station, a pharmacy. The data comes from OpenStreetMap.
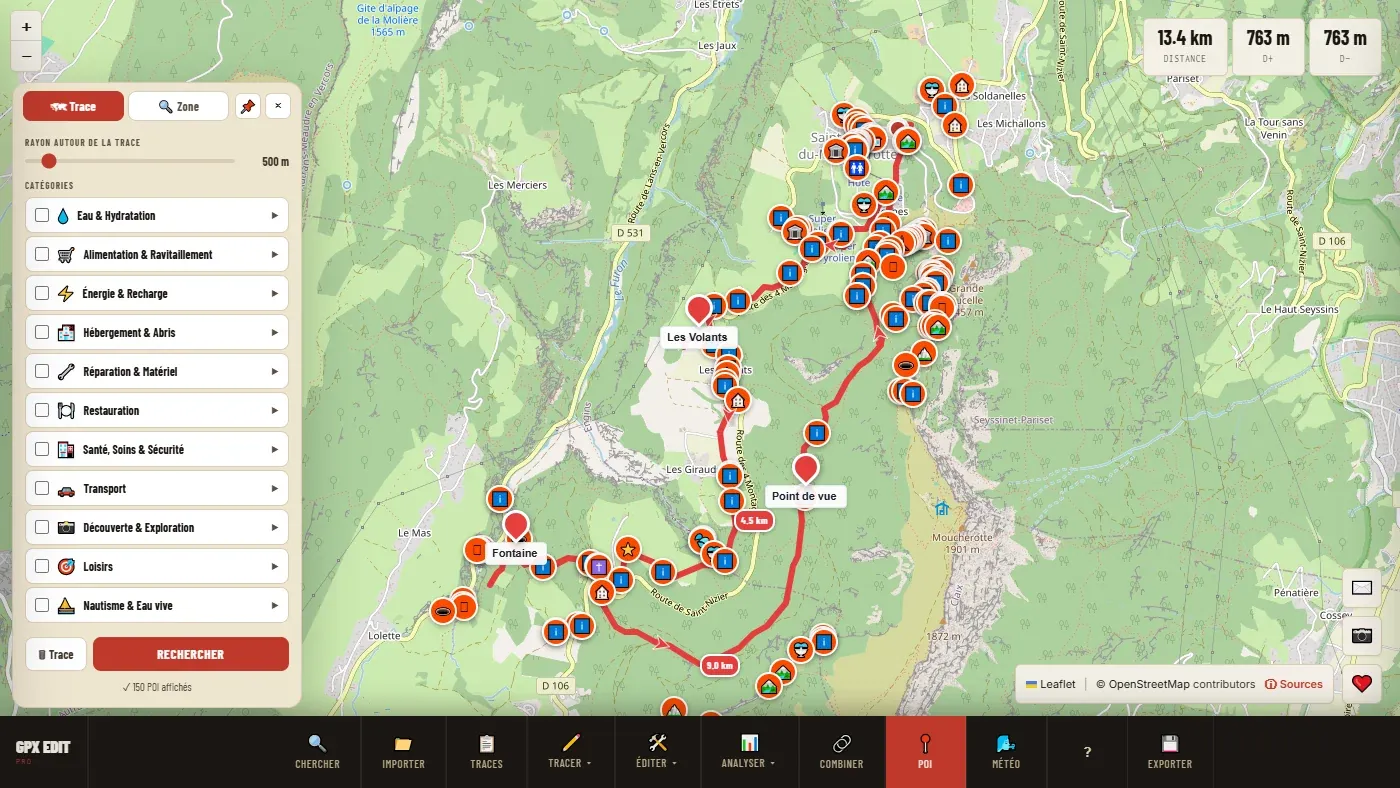
Along the track: 🗺 Track tab #
- Select the track.
- Set the radius around the track (100 m to 5 km, 500 m by default). Wider means more results but further away: a fountain 2 km from your path won't help you.
- Tick whole families, or open a family (▶) to choose precisely. "All" ticks everything.
- Search. The number of POIs found is shown; 🗑 Track clears them.
Around a place: 🔍 Area tab #
Searches the part of the map shown on screen, without a track. Handy for finding services around a start or accommodation. Move or zoom the map: the ↺ Refresh button runs the search again on the new area.
When both tabs have results, the "Layers" bar lets you show or hide each set, or clear everything (🗑 All).
The eleven families
| 💧 | Water & Hydration | Drinking water, fountains, restrooms. |
| 🛒 | Food & Supplies | Supermarkets, bakeries, grocery shops, greengrocers, vending machines, ATMs. |
| ⚡ | Energy & Charging | Phone charging, electric vehicle charging points. |
| 🏨 | Accommodation & Shelters | Hotels, campsites, lodgings, mountain huts and cabins. |
| 🔧 | Repair & Equipment | Bike repair, sports shops, garages. |
| 🍽️ | Dining | Restaurants, cafés, bars, picnic areas. |
| 🏥 | Health & Safety | Pharmacies, A&E, doctors, rescue services, defibrillators, emergency phones. |
| 🚗 | Transport | Stations, bus stops, car parks, petrol stations, airfields. |
| 📸 | Discovery & Exploration | Viewpoints, summits and passes, heritage, nature, curiosities. |
| 🎯 | Leisure | Bike parks, trail running starts, climbing, paragliding, ski lifts, cross-country skiing, riding centres… |
| ⛵ | Water sports | Slipways, clubs, harbours, boat hire, hazards and dams. |
When there are a great many POIs, only some are shown: zoom in to refine.
A POI's card #
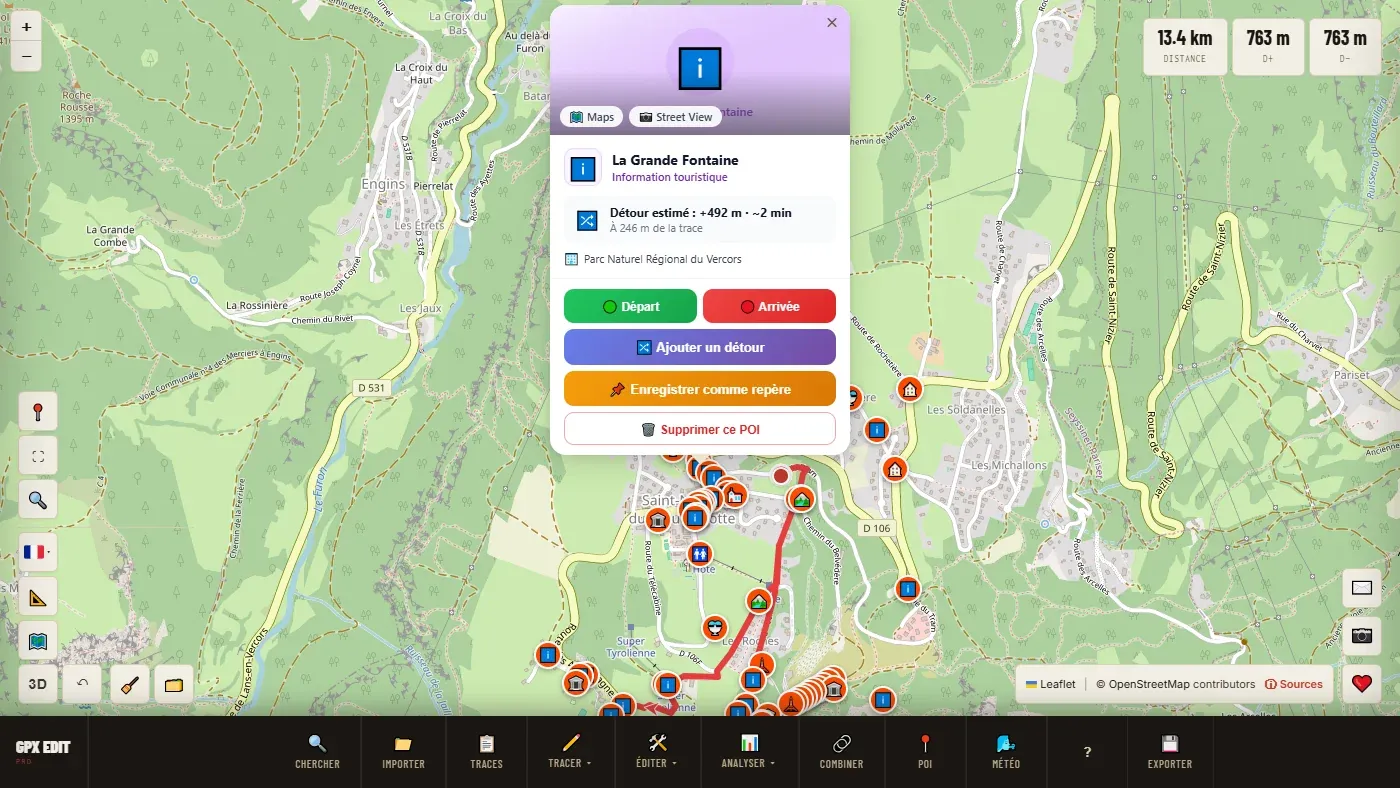
The card gives the type, the distance to the track and the estimated detour, and, when available, the opening hours (open or closed now), the phone number and the website. 🗺️ Maps and 📷 Street View links at the top. The buttons:
| 🟢 Start / 🔴 Finish | Start a route from this POI or to it. |
| 🔀 Add a detour | Routes the track via this POI. See below. |
| 📌 Save as marker | Turns the POI into a marker, which will go with your file. |
| 🗑️ Delete this POI | Removes it from the map. |
On export, a tick box lets you include all the POIs shown as markers (waypoints) in the GPX file.
Routing the track via a POI #
- In the POI's card: 🔀 Add a detour.
- Choose the routing profile (the one for the track's sport is highlighted).
- Choose the type of detour: Round trip (shorter, you come back the same way) or Continuous route (longer, no return).
The tool recalculates that part and gives the length of the detour. The start and finish of the track never move. This is how you add the village bakery without redoing the whole route. Undo: ↶.
Weather
Two different tools: 🌤️ Weather here for the forecast at a point on your route, 🌬️ Weather map for the wind, waves and tide over a whole region.
🌤️ Weather here #
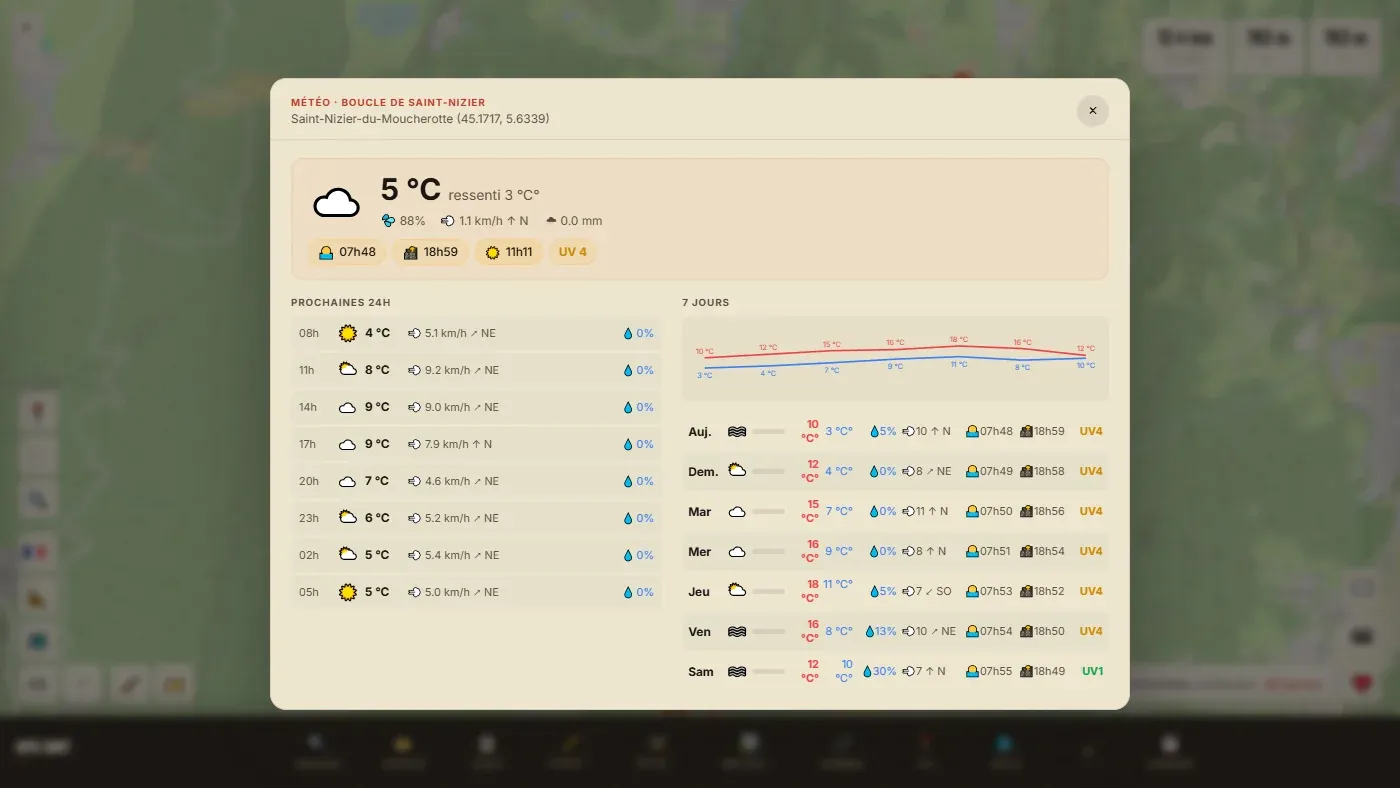
From the Analyze menu, the forecast is given at the start of the selected track (or at the centre of the map, without a track). From the right-click, at the place clicked: useful when crossing a mountain range.
You will find the temperature and feels-like temperature, humidity, wind, rain, sunrise and sunset, the UV index, the next 24 hours and the next 7 days. If the track climbs more than 300 m above the start, a column also gives the weather at the summit.
Wind, waves, tide and spots: see the chapter 🌬️ Weather map.
🌬️ Weather map: wind, waves, tide
For kitesurfing, wing foiling, windsurfing, surfing, sailing, sea kayaking and paddleboarding. The animated wind over the whole of Europe, then, for your spot, the hour-by-hour forecast: wind, gusts, direction, waves, period, water, tide and coefficient. Save your spots, say which conditions suit you: the tool looks for the next window over 7 days.
It is a separate tool: no track is needed. The map opens on the area you were looking at. Free, no account.
Overview: the wind over Western Europe #
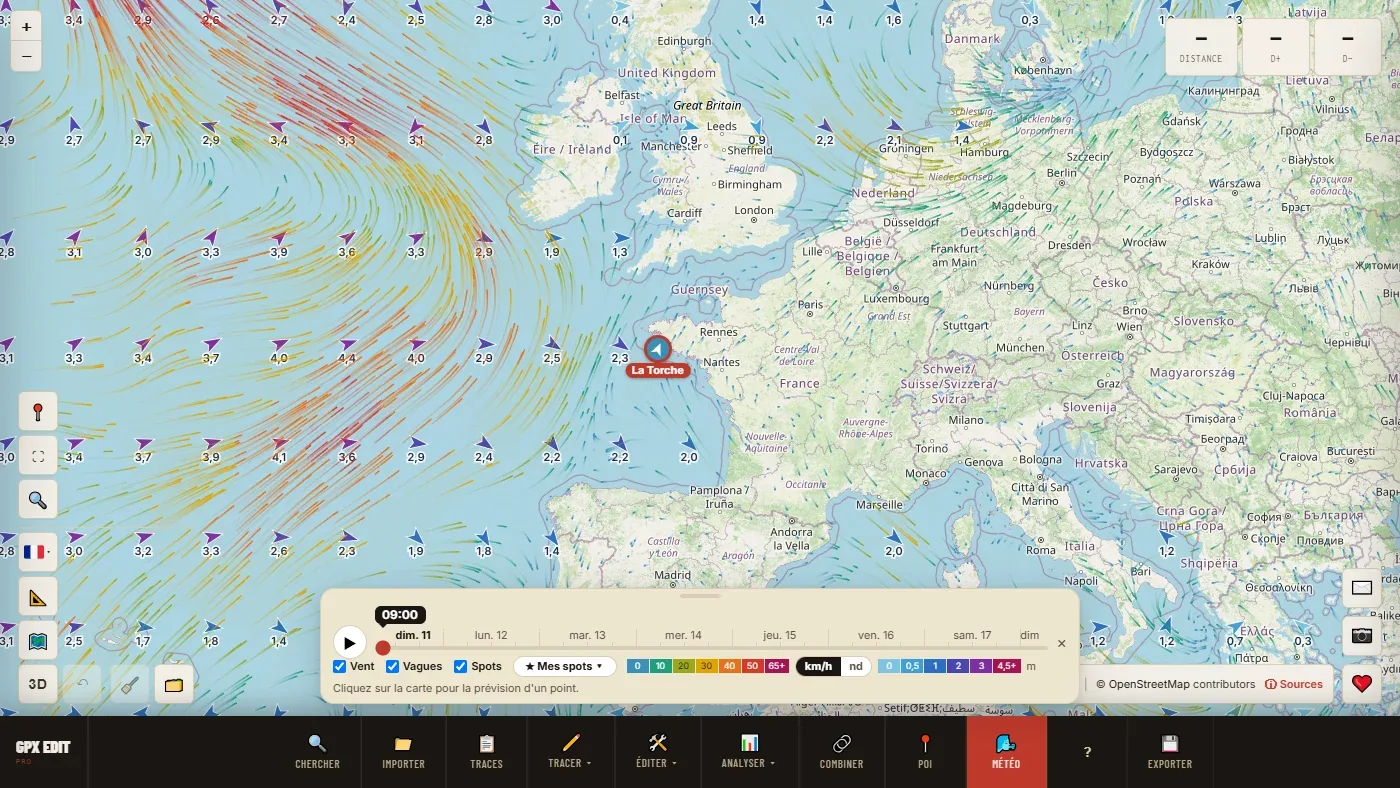
Zoom out until you can see the Atlantic, the English Channel, the Bay of Biscay and the Mediterranean.
- The animated lines are the wind. Their colour gives the strength: the legend goes from 0 to 65 km/h and above. The legend's km/h ⇄ kn button switches to knots, and remembers it.
- The arrows at sea show where the waves are going; the number is their height in metres (legend from 0 to 4.5 m and above).
- The slider covers the next 7 days, hour by hour. ▶ plays it: you see the low arrive, the wind veer, the sea build.
- On hover (computer), a bubble gives the wind in knots and in your unit, and near the sea whether the tide is rising or falling.
- The Wind, Waves and Spots boxes declutter the map.
First spot on the overview the day the wind sets in on your coast. Then zoom in on your area, and click your spot for the hour-by-hour detail.
A spot's forecast #
Click anywhere: on a spot, on the beach, at sea. The detailed forecast for the point opens, as a table.
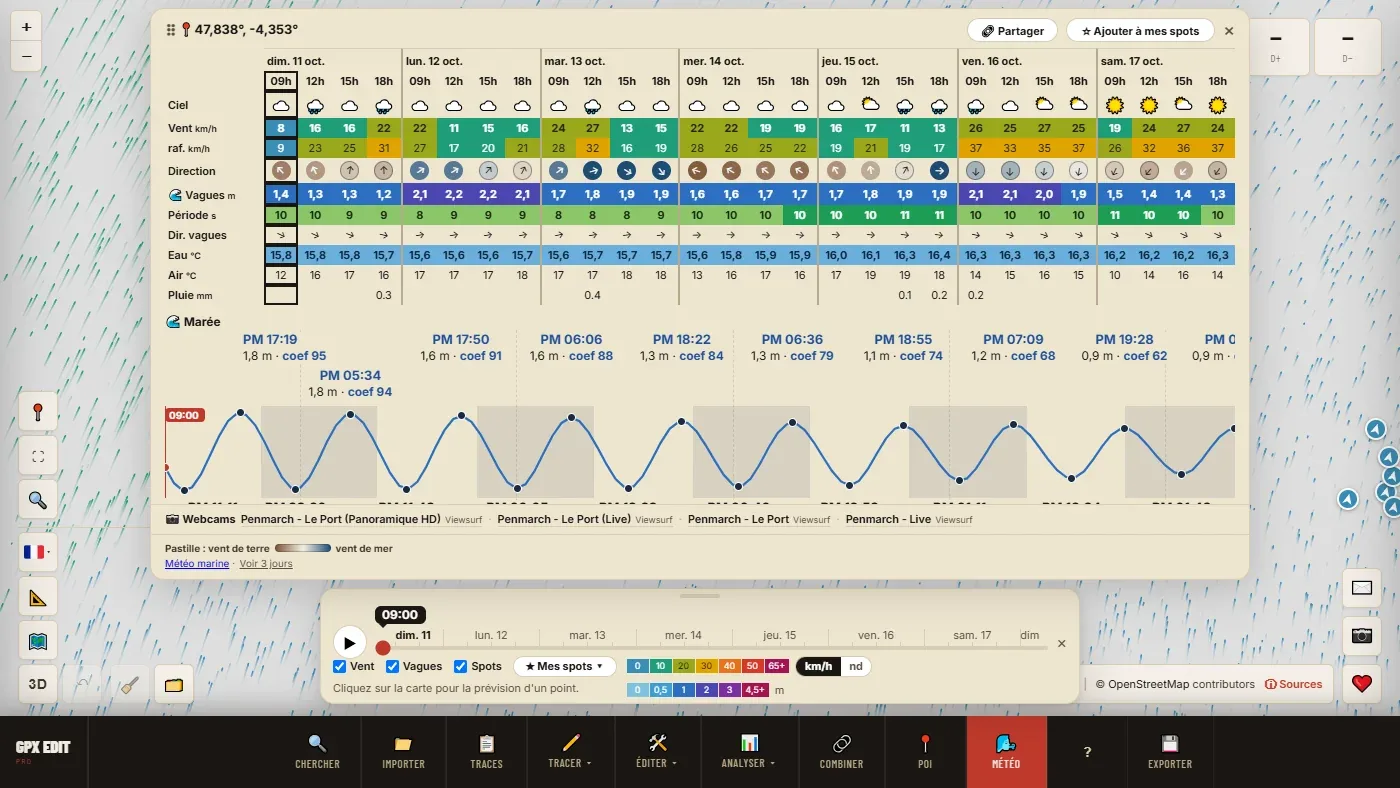
| Row | What it tells you |
|---|---|
| Sky | Sun, cloud, showers, thunderstorm. |
| Wind, gusts | Mean wind and gusts, with the map's colours. The difference between the two tells you whether the wind is steady. |
| Direction | The arrow points to where the wind is going: ↗ is a south-westerly. On hover, the bearing in degrees. Near the coast, the dot around the arrow is brown when the wind comes from the land (offshore), blue when it comes from the sea (onshore), and in between when it blows along the coast. It is worked out from the water the wind crosses before arriving, not from the orientation of the beach. |
| Waves, Wave dir. | Height in metres, and where they are going. |
| Period | In seconds. Pale below 8 s: short, choppy sea. Clear green around 10–12 s: well-organised swell. Blue-green beyond: long, powerful swell. |
| Water | Sea temperature, in blue below 17 °C: enough to choose your wetsuit thickness. |
| Air, Rain | Temperature (feels-like on hover) and rain in mm. |
| 🌊 Tide | High waters (High) and low waters (Low), height, coefficient of each high water. The curve covers the whole period; nights are greyed out, the red line is the slider's hour. |
| 📷 Webcams | Webcams within 3 km, opened in a new tab: a glance at the water before loading the car. |
- The columns go in 3-hour steps, in daylight only (from sunrise to sunset). Show 3 days / Show 7 days changes the length.
- Waves, period, water and tide are shown if the point is at sea or within 2 km of the shore.
- More precise wind at the water's edge. In France, Spain and Portugal, the wind comes from Météo-France's AROME model (1.5 km grid); in Switzerland and on the Alpine lakes, from MeteoSwiss; in Italy, from ItaliaMeteo; elsewhere, from Open-Meteo's default model. Within 2 km of the shore, the wind is taken from the sea cell, not from the land, where it is slowed down.
- Marine forecast, at the bottom, opens Météo-France's official bulletin.
- Move the window by its ⠿ handle; a double-click on the handle puts it back in place.
The spots on the map #
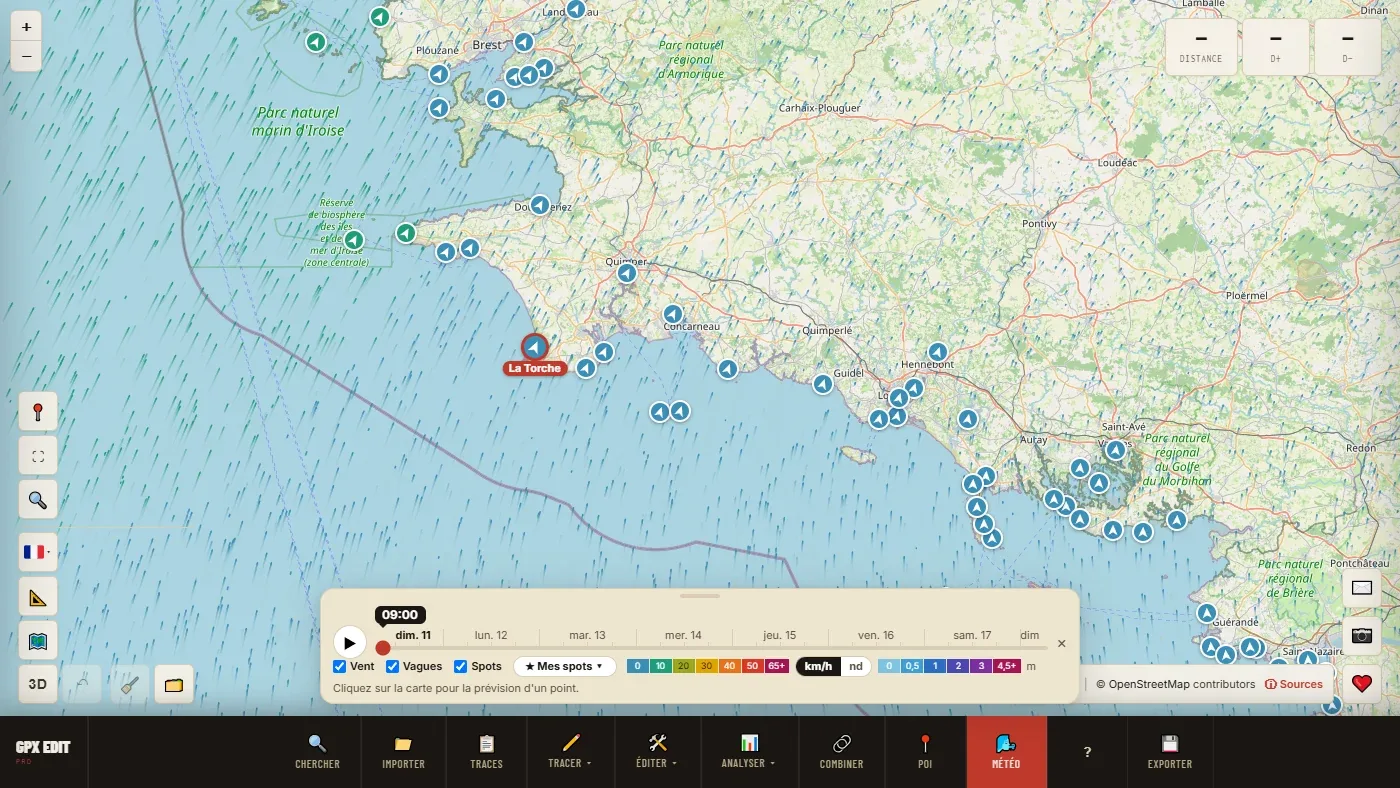
With the Spots box, the map shows kitesurfing, windsurfing, surfing and paddleboarding spots, and sailing and kayak clubs, all over the world near the sea or a large lake. They come from OpenStreetMap.
- Each dot takes the colour of the wind at the slider's hour, and its arrow the direction. Drag the slider: you can see at a glance which spot gets the right wind, and when.
- A click on a spot opens its forecast.
- Your spot isn't there? Just click the place: the forecast works everywhere. Then save it in My spots.
★ My spots #
- SaveOpen the forecast for the place, click ☆ Add to my spots, give it a name, OK. The spot appears on the map circled in red, with its name. The button becomes ★ My spot; clicking it removes the spot.
- Find againThe ★ My spots ▾ button in the bottom bar lists your spots. A click on a name centres the map and opens its forecast. ✕ deletes it.

With My conditions, the list becomes a dashboard: under each spot, the next window that suits you (✓ Tue 9:00 – 14:00), the onshore or offshore wind dot, and the best window of the 7 days when it is not the next one.
- 50 spots at most.
- Your webcams: on a saved spot, ✎ at the end of the Webcams row adds up to three webcam addresses of your own (the club's, the school's…).
- Spots are kept in this browser. 🗂️ My workspace saves them with your tracks: that is how you get them back on another device.
⚙ My conditions: your settings per spot #
Say once what makes a good session at this spot. The tool ticks the hours that suit and announces the next window.
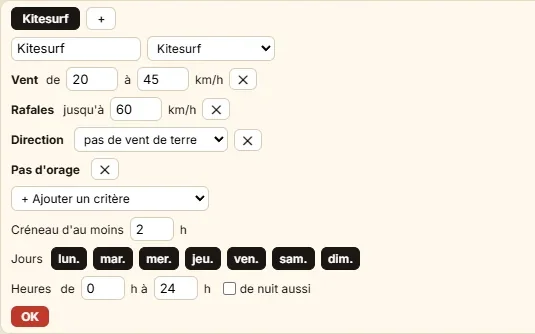
- OpenOn a saved spot, click ⚙ My conditions in the forecast. The button does not exist on a point that has not been saved.
- Start from a presetChoose your activity in the list, then rename the set if you like ("Kite 12 m", "Easy paddle").
- AdjustChange the values, ✕ removes a criterion, + Add a criterion adds one. Wind is entered in the map's unit (km/h or knots).
- Say when you are freeWindow of at least 1 to 12 hours in a row; Days (click to remove a day); Hours from… to…; night too, otherwise only daylight hours count.
- OKThe forecast gains a row named after the set, ticked ✓ at the right hours.
The + next to the tab creates another set for the same spot, up to four: "Kite 9 m" and "Kite 12 m", or "Surf" and "Paddle" on the same beach.
The water sports presets
| Preset | Wind (max. gusts) | Other criteria | Window |
|---|---|---|---|
| Kitesurfing | 20–45 km/h ≈ 11–24 kn (60 km/h) | No offshore wind, no thunderstorm | 2 h |
| Windsurf / wing | 18–50 km/h ≈ 10–27 kn (65 km/h) | No offshore wind, no thunderstorm | 2 h |
| Surfing | 0–25 km/h ≈ 0–13 kn (40 km/h) | Waves 0.8 to 3 m, period 7 s or more | 2 h |
| Sailing | 10–40 km/h ≈ 5–22 kn (55 km/h) | Waves 2.5 m at most, visibility 3 km or more, no thunderstorm | 3 h |
| Sea kayaking | 0–20 km/h ≈ 0–11 kn (30 km/h) | No offshore wind, waves 1 m at most, visibility 2 km or more, no thunderstorm | 3 h |
| Paddleboarding | 0–15 km/h ≈ 0–8 kn (25 km/h) | No offshore wind, waves 0.5 m at most, no thunderstorm | 2 h |
These are starting points: adapt them to your level, your gear and your spot. The list also offers Hiking, Trail running, Road cycling and MTB / gravel.
The available criteria
- Wind, Gusts
- A mean wind range (from… to…), a gust ceiling.
- Gusts above mean wind
- The maximum difference between gusts and mean wind: rules out gusty wind, under squalls or behind high ground.
- Wind direction
- A sector, from… to…, clockwise: from 225° to 315° is south-west to north-west.
- Direction (near the coast)
- Onshore wind, no offshore wind, or offshore wind: the same information as the dot.
- Waves, Swell, Period
- Height of the waves or swell (from… to…), minimum period.
- Tide
- Rising, falling, around high tide or around low tide (2 h before to 2 h after).
- Water
- Sea temperature, from… to….
- Rain over 3 h, Rain over the previous 48 h, Snow over 3 h, No thunderstorm
- The weather now, and the weather before (a waterlogged access path).
- Feels-like temperature, UV index, Visibility, 0 °C freezing level
- Comfort, haze, the freezing altitude.
Waves, swell, period, tide and water are only offered on a spot by the sea; onshore or offshore wind, only near the shore.
Reading the result
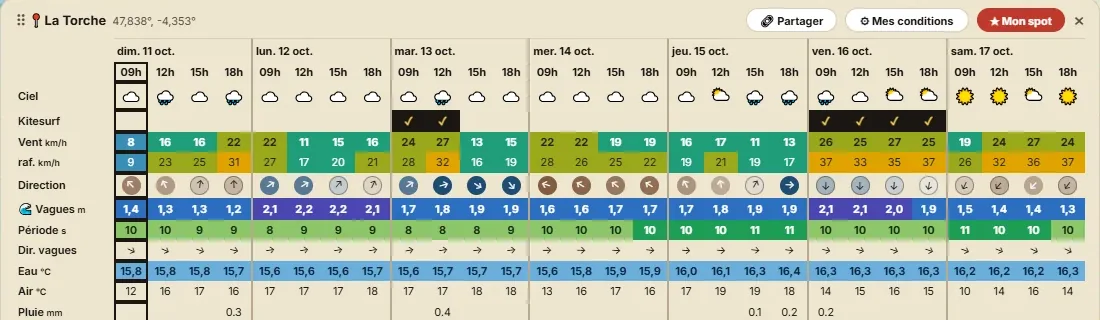
- ✓ marks every hour that meets all your criteria, within a long enough window. A small ☾ flags a night hour, if you have allowed them.
- ★ My spots announces the next window, and "best: …" for the longest of the week.
- Nothing in 7 days? The list says what is blocking, in brackets: "nothing in 7 days (wind)". That is the criterion to relax. "(duration)": the window asked for is too long; "(days and hours)": no hour is allowed.
A few useful settings
- Kite, wing, windsurf: if your spot only works in a south-westerly to north-westerly, add Wind direction from 225 to 315 on top of "no offshore wind".
- After work: Days Mon. to Fri., Hours from 17 to 21. Weekends only: Sat. and Sun.
- Surfing: add Direction: offshore wind to keep only the hours when a light wind holds up the waves.
- Sea kayaking, paddleboarding: Tide: around high tide for an estuary or a bay that dries out.
- Sailing: a window of at least 4 h for a proper sail.
- Without a thick wetsuit: Water from 17 °C.
🌊 Tide here #
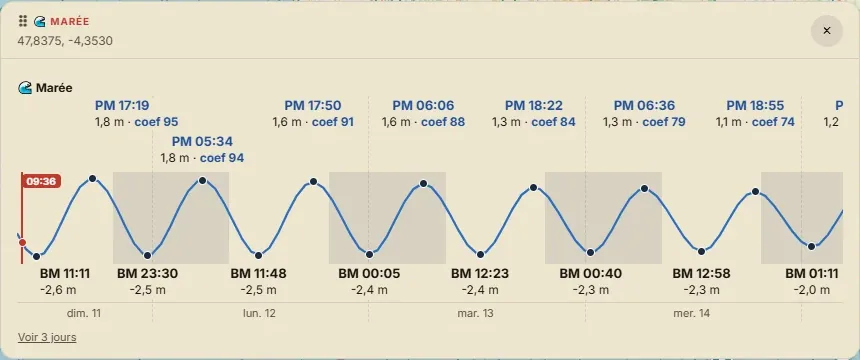
The tide without opening the weather map, for example when preparing a kayak outing along the coast. 3 days, or 7 with Show 7 days.
The coefficient is only given on Europe's Atlantic seaboard, from Portugal to Norway, including the English Channel and the North Sea; elsewhere, only the times and heights.
🔗 Sharing a spot #
🔗 Share, at the top of the forecast, copies a link (on a phone, it opens the phone's share sheet). The link opens the weather map centred on the spot, with its forecast and its name: just the thing to send to the club group or your Sunday crew.
On a phone, the bottom bar folds away; tap it to unfold it. Windows can be moved with a finger by their handle.
The colours show an intensity, the ✓ your own criteria: neither is a safety level. These are model forecasts, which can be wrong, especially beyond two or three days. The tide is calculated: for navigation, the official tide tables (the SHOM in France) are authoritative. Check the marine forecast, look at the water, and the decision to go out remains yours.
- "Request limit reached"
- The forecast service limits the number of calls. The tool retries on its own after a minute; otherwise, come back a little later.
- "Zoom in to show the wind map"
- The map is too zoomed out to calculate the wind: move in closer to the area.
- "No waves or tide here (inland)"
- The point is more than 2 km from the shore. Click closer to the water.
- The ⚙ My conditions button doesn't appear
- It only exists on a saved spot: first click ☆ Add to my spots.
- No tide coefficient
- It is only calculated on Europe's Atlantic seaboard. In the Mediterranean, the tide is small anyway.
- My spots have disappeared
- They are kept in the browser: another browser, a private window or clearing the site's data makes them disappear. Restore them from a My workspace backup.
Combining tracks
Two related functions that should not be confused:
| 🔗 Merge (in Edit) | Puts tracks end to end to make a single one. You already know what you want to assemble. |
| 🔗 Combine (toolbar) | Takes a set of tracks from the same area, finds where they cross and looks for the largest possible loop: start = finish, no out-and-back, no figure of eight. |
Using the combiner
- Load the tracks ➕ Add GPX files from your disk (each addition accumulates), or ➕ Add selection to use tracks already open. Two tracks at least.
- Generate 🔄 Generate loops.
- Choose Each loop found is shown with its distance. 👁 Preview shows it on the map, ➕ Editor adds it to your tracks, 💾 GPX downloads it.
✕ Reset empties the list to start with another batch.
It is the tool for areas you know well: you have a dozen favourite sections, and you are looking for the big loop that links them.
- "No viable loop found"
- The tracks don't cross or share no section. Add a track that links the others.
River and seashore
A separate module, for kayaking, canoeing and paddleboarding. It is triggered by choosing the 🛶 Waterway profile in the "Create a route" window.
It is a planning tool. It knows nothing about the flow, the state of the river or nautical hazards. The coastal module follows the shore: it does not navigate offshore. The marine forecast and the state of the water remain entirely your responsibility.
Paddling down a river #
Choose 🛶 Waterway, then place your points as for an ordinary route. The calculation follows navigable rivers, canals and channels, not streams or ditches. A point placed slightly off the water is brought back onto the waterway; too far away, it is refused.
The direction. The window announces the direction detected from the elevation: downstream, or upstream against the current. Going upstream triggers a warning, because that is rarely what you want in a kayak.
The duration is estimated at an average paddling speed, shown in the window.
- "No navigable route between these points"
- The network is broken between your two points: a dam, an unmapped section, two basins that don't connect. Move your points closer together or split the route.
- "A descent cannot be looped"
- 🔄 Loop makes no sense on a descent: use the return shuttle.
⚠️ Hazards #
The Hazards button finds along the route what is mapped as a dam, weir, lock, rapid, waterfall or portage. Each hazard appears on the map; a click gives its type and its grade when it is recorded.
"No mapped hazard" does not mean there are none: only that nobody has entered them in OpenStreetMap. An unmapped dam is still a dam. Scout the route by other means.
🌊 Follow the coast #
Route calculation does not work at sea: there are no paths. Instead, this button builds a track that follows the coastline, 150 m or 300 m from the shore (300 m by default).
Place a start and a finish, choose the distance, then Follow the coast.
The banner only speaks up if there is a deviation to report: the track goes further out than asked (cutting across a cove), or passes closer to the shore in places. The tool does not go into every cove, otherwise the track would become lacework that nobody paddles.
- "Too long for a coastal construction"
- Split the outing into several legs.
- "No usable coastline near these two points"
- Move the points closer to the shore.
🚣 Slipways #
Zoom in on the area: mapped slipways, ramps and landing stages appear, with the nearest car park. A starting point placed near one of them snaps to it and tells you so. A point placed far from any slipway is flagged as a "Free point": it is up to you to check that launching there is possible and allowed.
📷 GPS photos
Three uses, brought together in one window. Photos stay in your browser: they are not sent anywhere, and are not kept in the automatic save, in "My workspace" or in GPX files.
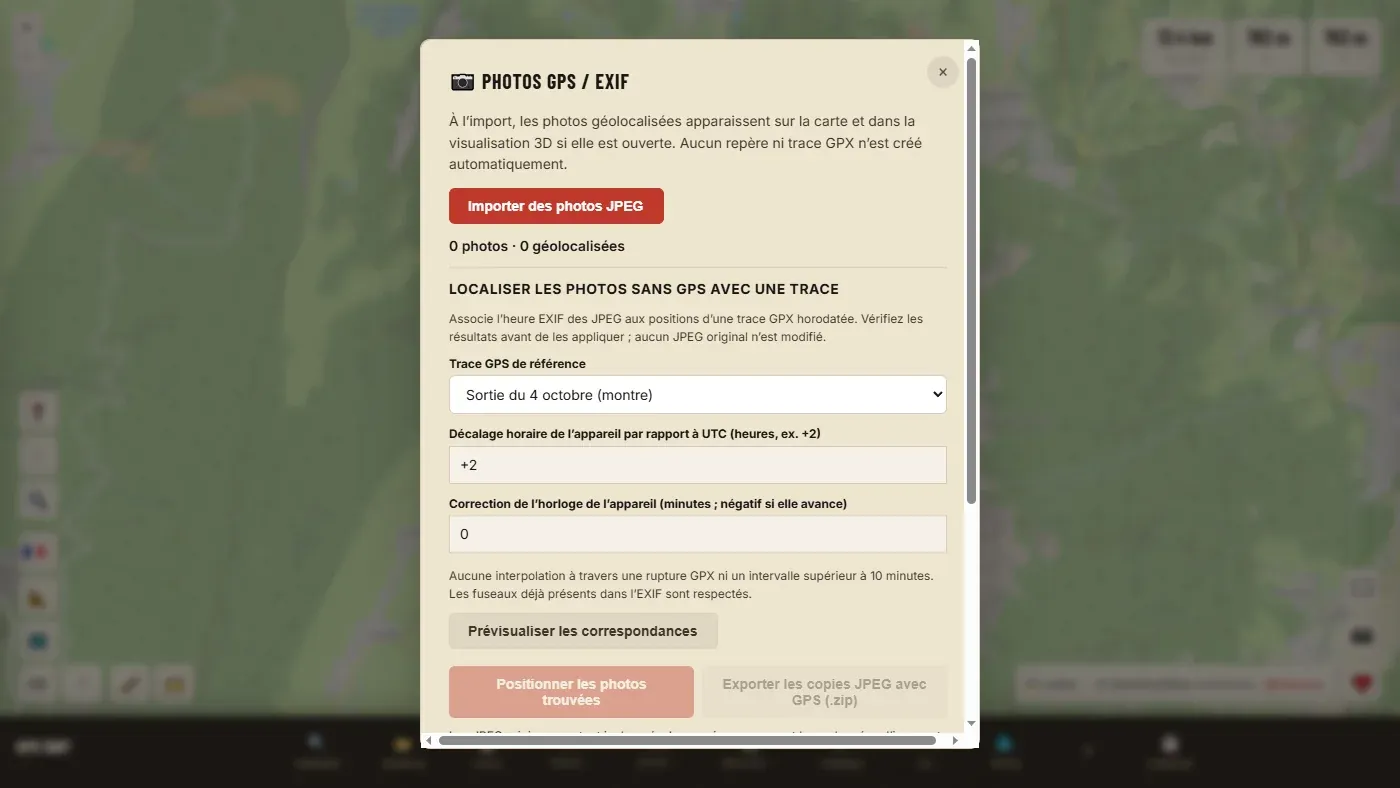
Seeing your photos on the map #
Import GPS photos: photos that contain a GPS position appear on the map, and in the 3D view if it is open. 250 photos per session at most. Remove displayed photos takes them off the map, without touching the tracks or markers.
Locating photos taken without GPS #
Your camera has no GPS, but your watch recorded the outing: the time of each photo makes it possible to find where it was taken.
- Import the outing's timestamped track, then the photos.
- Choose the reference GPX track.
- Enter the camera's time offset from UTC (+2 in summer in France, +1 in winter; 0 or +1 in the UK), and if necessary the clock correction (in minutes, negative if the camera's clock is fast).
- Preview matches, then Place matched photos on the map.
- To keep the result: Export GPS-tagged JPEG copies (.zip). The copies receive the coordinates, without recompression; your originals are not modified.
A photo taken outside the track's times, or during a gap of more than 10 minutes in the recording, is not located. If the photo already states its time zone, that is used.
Creating markers from photos #
Add GPX waypoints creates a marker at each photographed position, with the photo's name and date. The markers go with your GPX; the images do not.
Export and share
💾 Exporting a file #
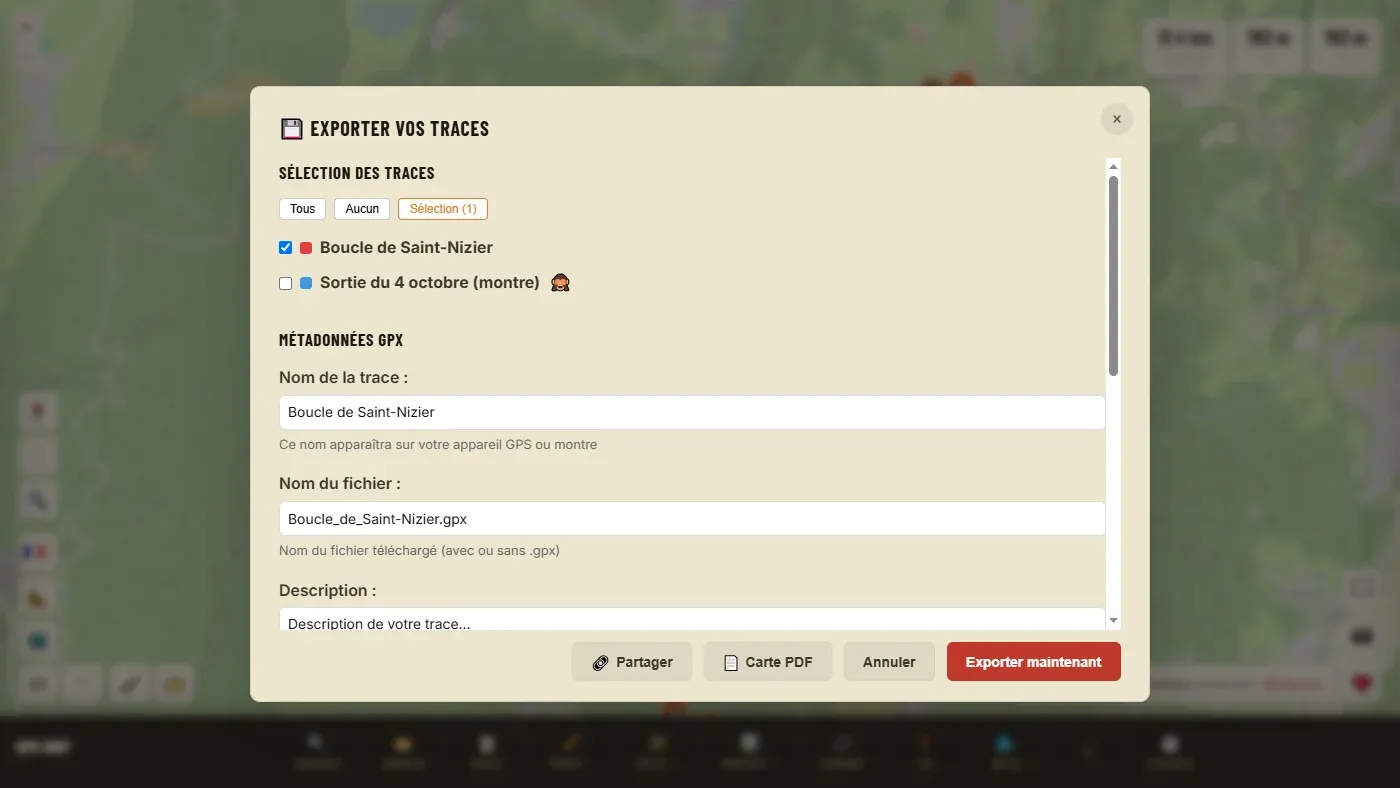
Step by step
- Track selection: tick the ones to export (All, None, Selection buttons).
- With several tracks: Separate files (one file per track) or Single file (all in one file).
- Fill in the metadata (see below).
- Set the markers and POIs, choose the format.
- Export now: the file lands in your downloads.
Metadata
| Track name | The name that will appear on your GPS or watch. Take thirty seconds to fill it in: in six months, "track-2" will mean nothing to you. |
| File name | The name of the downloaded file, with or without .gpx. |
| Description, Author, Copyright, Web link | Optional. Useful if you publish the track. |
Markers and POIs
- The map's markers go with the track. Tick In a separate file to have them separately. With no track ticked, only the markers are exported.
- Include Points of Interest as waypoints adds all the POIs shown to the file.
- For a track resulting from a merge in itinerary mode, a tick box keeps the stages as separate segments.
Choose the format
| Format | What for |
|---|---|
| GPX | The default choice, and the right one in almost every case: read by all GPS units, watches and apps. |
| KML | Google Earth, Google Maps and most web mapping tools. Markers and breaks included. |
| TCX | Garmin Connect, Polar. A planned track (without times) becomes a course to follow; a recorded outing stays an activity. |
There is no FIT export: for a Garmin watch, GPX is fine.
- I can't find the file
- It is in your browser's Downloads folder. With "Separate files", the browser may ask for permission to download several files: accept.
- "Please select at least one track to export"
- No box is ticked at the top of the window.
📄 PDF map #
A printable document per track: the map of the route on a topographic base, the key figures, the profile, the points of interest and markers, the country's emergency numbers, the route card and a QR code.
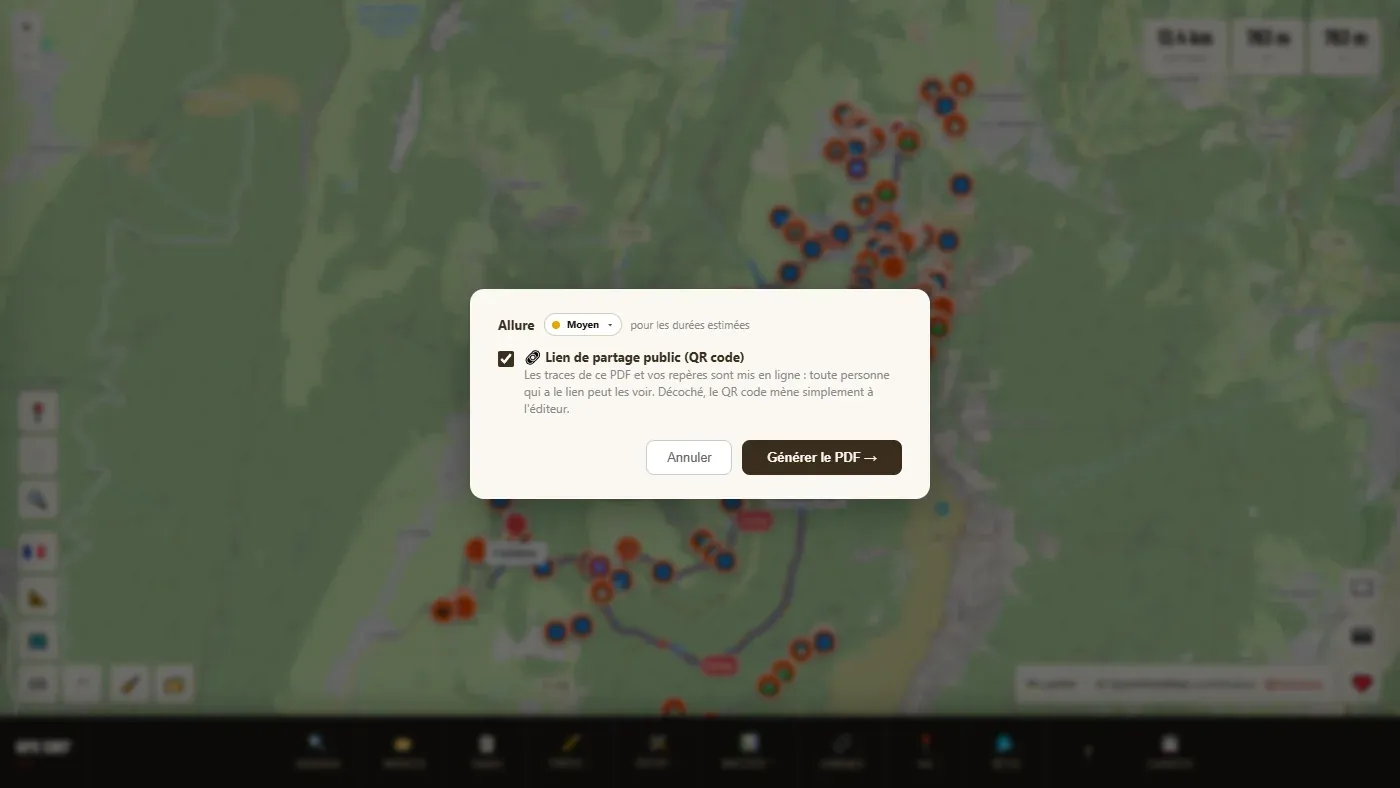
- In the export window, tick the tracks, then 📄 PDF map.
- If a track has no sport, choose one: it sets the difficulty and the durations.
- Check the pace, and decide on the public share link (QR code).
- Generate PDF. You receive a ZIP file containing, for each track, the PDF map and the GPX file.
With the box ticked (the default), the tracks in the PDF and your markers are published: anyone who scans the QR code can see them. Unticked, the QR code simply leads to the editor.
- The route card only appears if the track has intermediate points (nearby markers, or a split by kilometres).
- With the interface in Japanese, the PDF is written in English (the PDF font does not have Japanese characters).
🔗 Sharing a link #
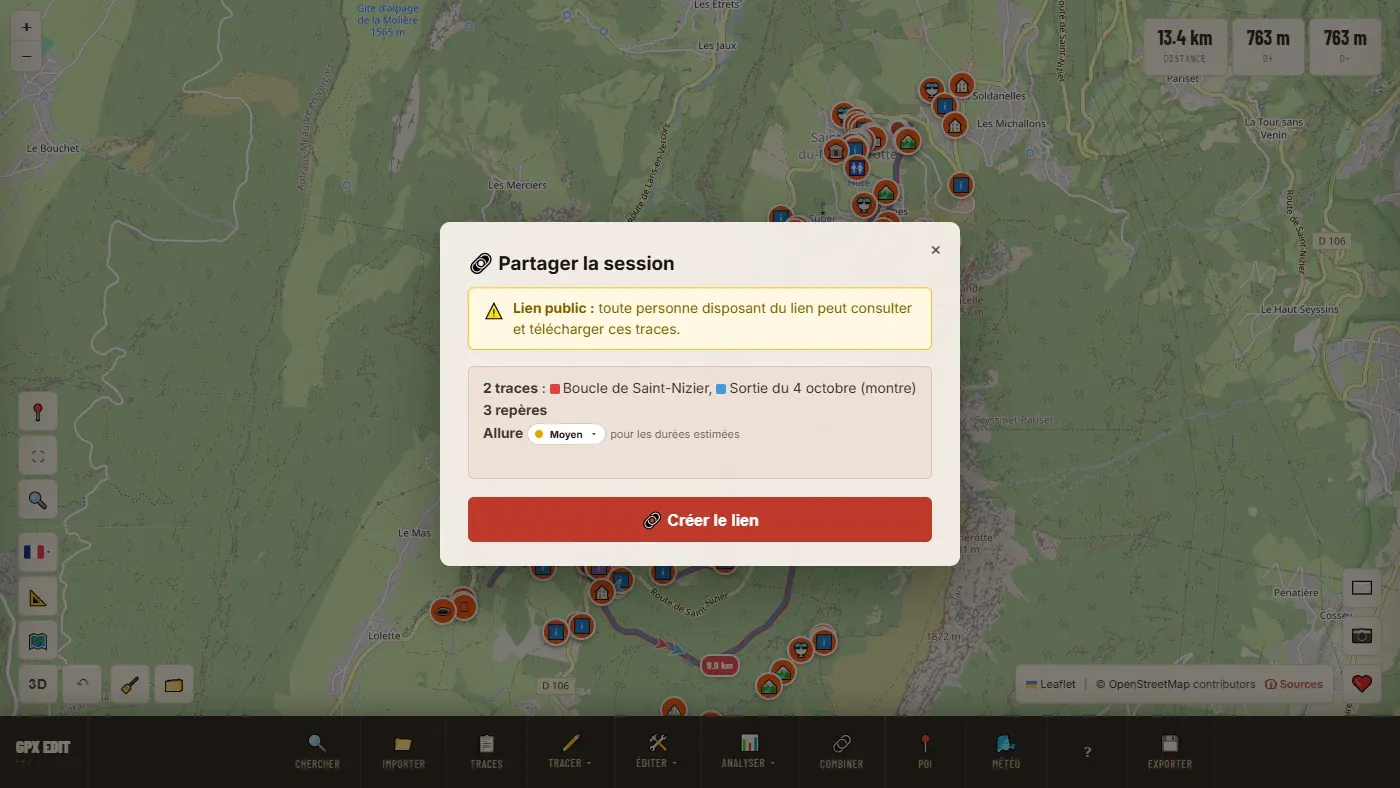
Creates a link and a QR code to a public page for your outing (preview, distance, elevation gain), from which anyone can open your tracks and markers in their editor, with no account or app. Handy for putting an outing plan to the group, or for moving from computer to phone.
- 🔗 Share. The window summarises what will be sent: all the loaded tracks and the markers.
- Create link. If a track has no sport, you are asked for it (it is used in the title of the share page).
- 📋 Copy the link, or have the QR code scanned.
- The link is public and permanent: anyone who has it can see and download these tracks, without an account.
- Whoever opens the link can edit the tracks on their side: it changes neither the link nor your tracks.
- Sharing is the only function, together with the PDF's QR code, that sends your tracks to the server.
3D and flyover video #
Opens your tracks in relief in a new tab. With no track loaded, the button opens the 3D view on its own, to explore any place.
- Colour by elevation, gradient, terrain type, or the track's original colour.
- Choice of base layer and relief quality, markers and GPS photos shown.
- Sunlight at a given date and time, and a video of the sun's path.
- Flyover video in MP4: landscape, vertical, square or portrait; short, social media, auto or long; with or without music. The video is made in your browser and needs a computer.
- Image capture and a share link for the view.
The 3D view has its own help: the "About & FAQ" button at the top of its page.
Settings
🗺️ Basemap #
Sixteen basemaps. The right one depends on what you are looking for: a topographic map to read the relief, satellite imagery to check that a path still exists.
| World | |
|---|---|
| Standard | Classic OpenStreetMap, readable everywhere. |
| World (Latin names) | Like Standard, with names written in the Latin alphabet everywhere. |
| Topo | Contour lines and relief. The hiker's background. |
| CyclOSM | Highlights cycling infrastructure. |
| Dark | Dark background, comfortable at night. |
| Regional: the map centres on the country | |
| IGN map, IGN satellite | France: official mapping and aerial photography. |
| Swisstopo | Switzerland. |
| TopPlusOpen | Germany. |
| ČÚZK | Czechia. |
| Kartverket | Norway. |
| GSI | Japan. |
| basemap.at | Austria. |
| IGN | Spain. |
| NGI | Belgium. |
| USGS Topo | United States. |
The "ⓘ Sources & licences" link at the bottom of the panel lists the data providers. The editor reopens on the last basemap and the last place displayed.
📐 Units #
Distances in km / m or in mi / ft, temperature in °C or °F. The setting applies everywhere: profile, statistics, route card, PDF. The page reloads to apply it; your tracks come back thanks to automatic saving.
Units are independent of the language: you can read the interface in French and keep miles.
Language #
Eleven languages: French, English, Spanish, Italian, German, Portuguese, Dutch, Norwegian, Danish, Swedish, Japanese. The flag at the bottom left (on the right on a phone) opens the list. The page reloads in the new language; your tracks are kept.
On phone
The editor works on phones, with an adapted interface. Almost all the functions are there; they are simply arranged differently.
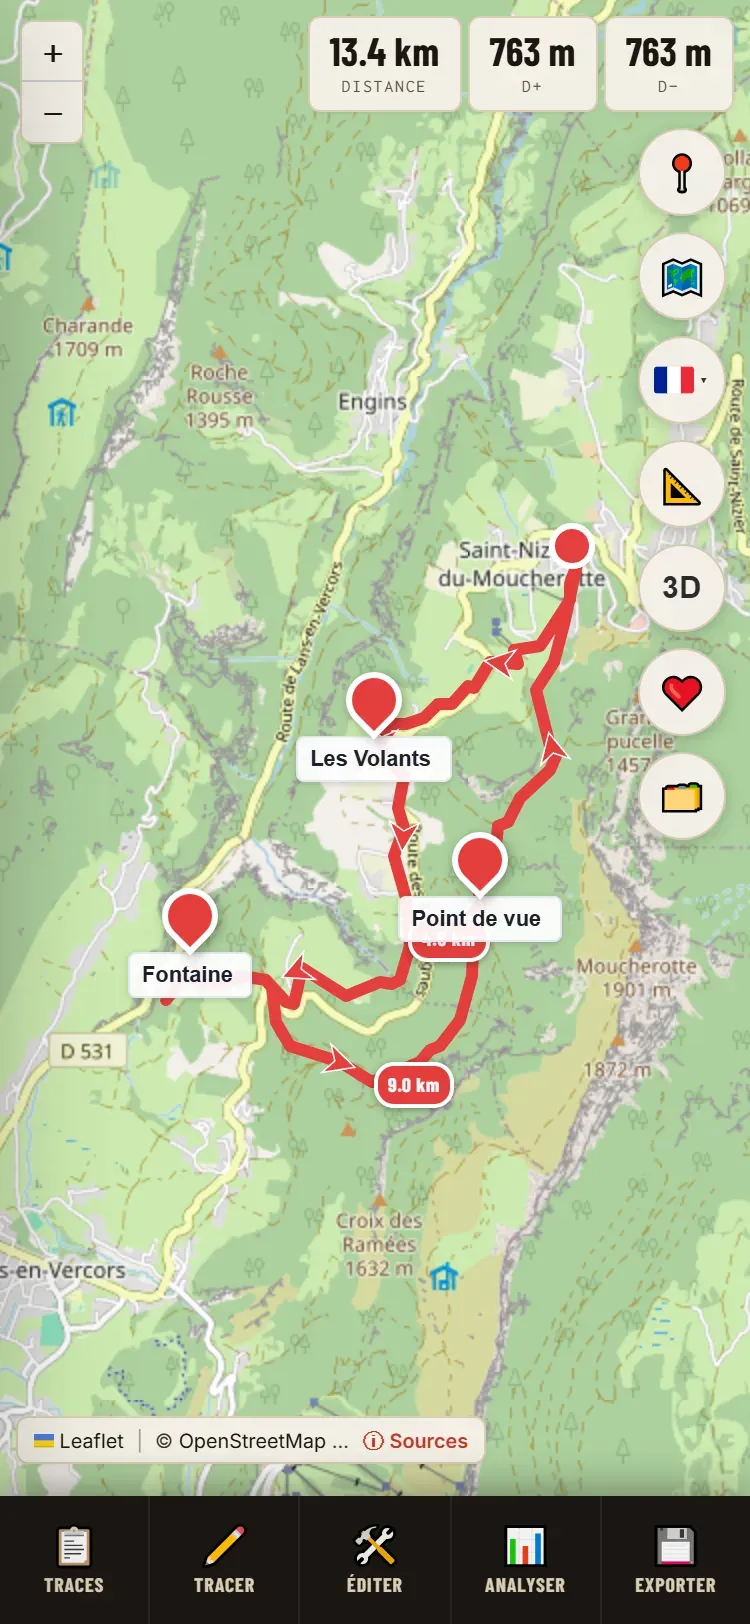
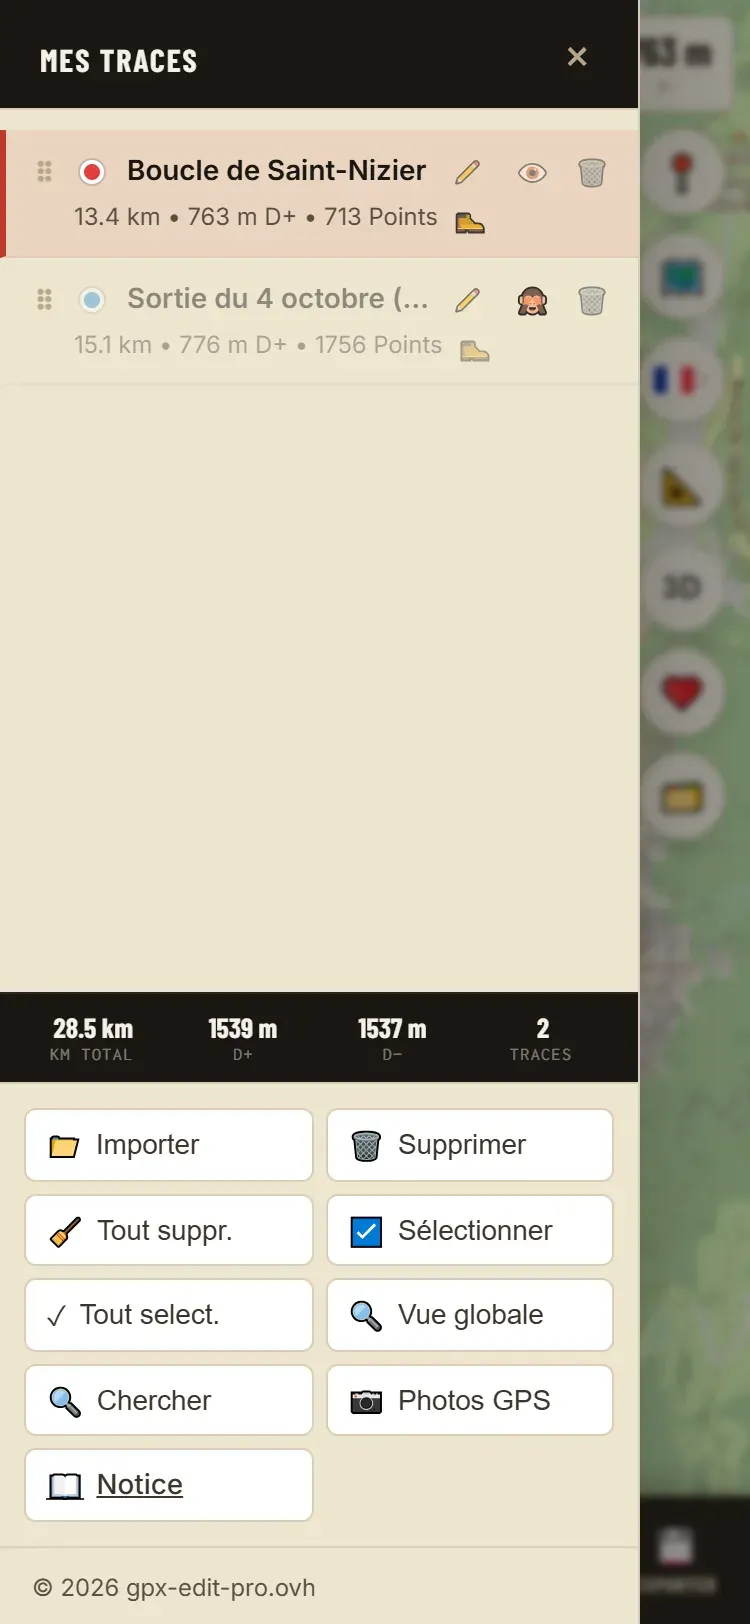
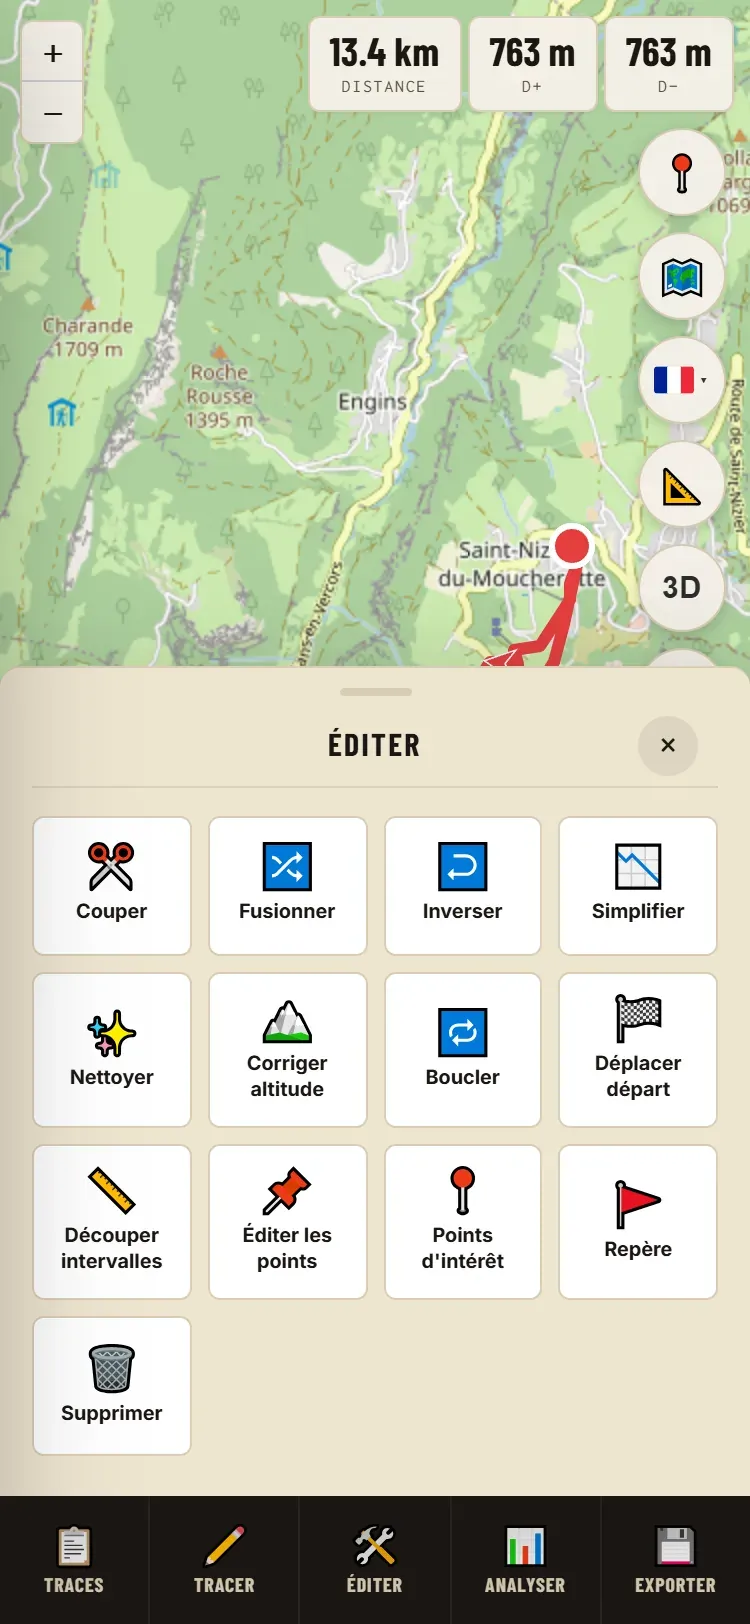
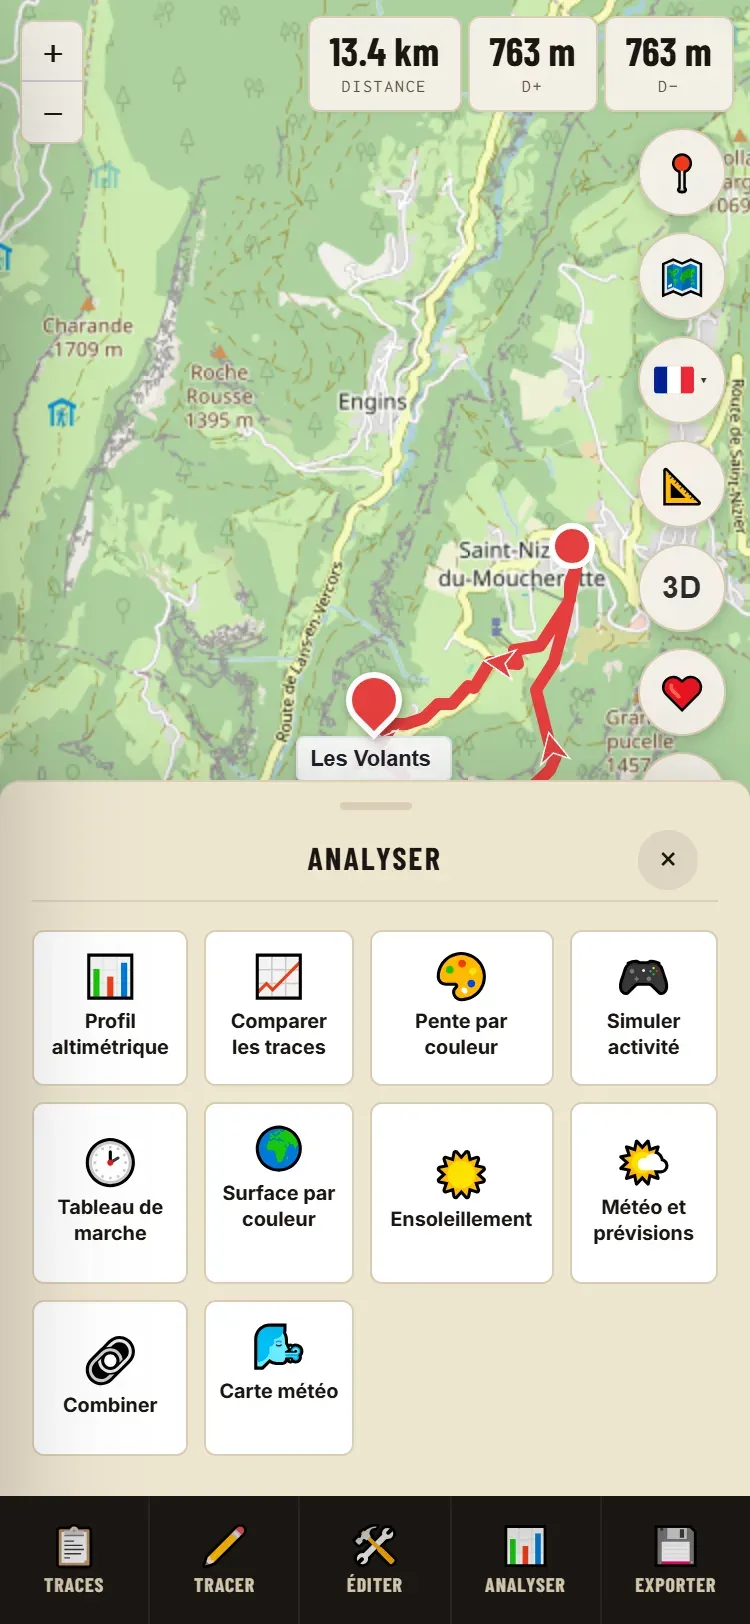
What changes
| On computer | On phone |
|---|---|
| Toolbar with eleven buttons | Bar with five buttons: Tracks, Draw, Edit, Analyze, Export |
| 🔍 Search, 📁 Import, 📷 Photos in the bar | In 📋 Tracks |
| 📍 POI in the bar | In 🛠️ Edit → Points of interest |
| 🔗 Combine and 🌬️ Weather in the bar | In 📊 Analyze |
| Map buttons at the bottom left | Column of round buttons on the right: location, basemap, language, units, 3D, support, My workspace |
| Panels and windows | Panels that slide up from the bottom of the screen; swipe them down to close them |
| Right‑click | Long press on the map |
| Keyboard shortcuts | Not applicable |
What does not exist on phone
- ⚙️ Reshape: it needs a pointing precision a finger cannot give.
- Making the flyover video in the 3D view.
Tips
Turn the phone to landscape to draw: the map is wider. Zoom in before placing a point: the closer you are, the more accurately it lands. To move a project from computer to phone, use 🔗 Share (scan the QR code) or 🗂️ My workspace.
Frequently asked questions
The questions we are asked most, with a link to the full explanation.
Saving and files
I closed the tab: have I lost my work?
Normally not: reopen the editor in the same browser and your tracks come back. They do not come back on another device, after a private window, or if the site's data has been cleared. → Automatic saving
How do I get my tracks on another device?
Three ways: export the GPX and open it there; or save with 🗂️ My workspace and load the file again; or create a link with 🔗 Share and scan the QR code. → My workspace, Share
I can't find the exported file.
It is in the browser's Downloads folder. On a phone, look in the Files app. → Export
How do I put my track on my watch or GPS?
Export it as GPX, then import that file into your watch's or GPS's app (for example the Courses section of Garmin Connect). Give it a name on export: that is the one that will appear on the device. If the device refuses it or struggles, simplify the track. → Export, Simplify
Can I export to FIT?
No: GPX, KML or TCX. Garmin devices read GPX perfectly well. FIT can be imported, however. → Accepted formats
My GPS refuses the file, or takes forever to load it.
Too many points. 📉 Simplify with a tolerance of 10 to 20 m often divides the number of points by five or ten without the line visibly moving. → Simplify
One of my software refuses my file even though it opens everywhere else.
First check that the software is still maintained: several old tools no longer read current files correctly. Also try another format (TCX for Garmin Connect or Polar).
Draw
I click on the map and nothing happens.
No drawing mode is active. Go through ✏️ Draw first. Outside that mode, a click on the map creates nothing: that is intentional. → Creating a track
I drew my route, but the export finds nothing.
The line has not been saved: click ✔ Save in the route window. It is the most common oversight. → Via routing
The route doesn't go along the path I want.
Add a waypoint on that path, or drag the route. If the path does not exist in OpenStreetMap, the calculation cannot use it: draw that section with Freehand. → Via routing, Freehand
I changed profile and my whole route changed.
That is normal: changing profile recalculates the whole route. To mix road and trail, make two tracks and then merge them. → Via routing
How do I route my track via a particular point (a bakery, a spring)?
If it is a POI: its card → 🔀 Add a detour. Otherwise, while drawing, add a waypoint at that spot. → Detour via a POI
The automatic loop finds nothing, or it is blocked.
Reduce the distance, move the start to an area rich in paths, set the direction back to AUTO. Generation is limited to five per hour. → Auto loop
Editing
The buttons in the Edit menu are greyed out.
No track is selected. Click the track on the map or in 📋 Tracks. Merge and Compare need at least two; Clean up, Reshape and Cut need exactly one. → Selection
How do I delete the start or the end of my track?
Cut at the place you want (✂️ Cut, or right-click the track → Cut here), then delete the piece you don't need. To isolate a section in the middle, select it on the profile. → Cut
My track has strange spikes, or a distance that is too long after a break.
Those are GPS spikes and points wandering on the spot during the stop. ✨ Clean up removes them, with a preview. → Clean up
I made a mistake.
↶ Undo (Ctrl+Z) undoes the last twenty operations, one by one. → Undo
Figures
My elevation gain is absurd, or very different from Strava or my watch.
A big difference almost always comes from the watch's barometer drifting: 🏔️ Correct elevation. A small difference (a few per cent) is normal: each service smooths and calculates in its own way. → Correcting the elevation
The elevation correction barely changes anything.
That is normal if the track had no barometric elevation: a drawn or calculated track already takes its elevation from the terrain model. → Correcting the elevation
The estimated duration doesn't match me.
Change the pace (Relaxed to All-out), or enter your own with "My pace…". Check the track's sport too. → Sport, pace and durations
Why does the editor ask me for the sport?
It sets the duration, the difficulty and the title of the share page. It is only asked once per track, when a tool needs it. → A track's sport
The simplifier shows "heavy simplification". Is that serious?
Not necessarily: the warning appears from 70% of points removed, which is common on a watch track. Check that the shape stays faithful. → Simplify
Everything else
The sunlight calculation runs for a long time.
That is expected: it examines the relief and the forests around each point. On a long mountain route, allow several tens of seconds. → Sunlight
How do I know when my spot will work?
Save it (☆ Add to my spots), then ⚙ My conditions: choose the preset for your activity and adjust it. ★ My spots then announces the next window over 7 days, or what is blocking it. → My conditions
The brown or blue dot around the wind arrow?
Brown: the wind comes from the land (offshore). Blue: it comes from the sea. In between: it blows along the coast. → A spot's forecast
"My location" doesn't work.
The browser must be allowed to locate the device. If you refused, allow it again in your browser's site settings.
Does the share link expire?
No, it is permanent and public. Don't share a track that reveals your home. If a link has been shared by mistake, write to us with the link. → Share
I can't find a function on my phone.
Search, Import and Photos are in 📋 Tracks; POIs in 🛠️ Edit; Combine and the Weather map in 📊 Analyze. Only Reshape does not exist on phones. → On a phone
Is my data sent anywhere?
Your files, no: they are read in your browser. The online calculations (route, elevation, weather, place search) receive only the coordinates they need. Only 🔗 Share and the PDF map's QR code publish your tracks, and they warn you. → Before you start
My question is not here.
Use ✉️ Contact us, at the bottom right of the editor. Say what you were trying to do, at which step it got stuck, on which device and in which browser, and what you intend to do with the file afterwards: the problem sometimes lies with the destination software. Attaching the track, or a share link, helps a lot.
Keyboard shortcuts
On computers only. ? shows this list at any time. Shortcuts do not work when the cursor is in an input field.
| Shortcut | Action |
|---|---|
| Ctrl+Z | Undo last operation |
| Ctrl+A | Select all |
| Delete | Delete selection |
| Ctrl+D | Draw (opens the choice of modes) |
| Ctrl+K | Cut the track (one track selected) |
| Ctrl+F | Merge (at least two tracks selected) |
| Ctrl+I | Reverse |
| Ctrl+B | Loop |
| Ctrl+E | Export |
| Ctrl+H | Elevation profile |
| Ctrl+P | Slope by color |
| Ctrl+U | Surface by color |
| Ctrl+O | Points of interest |
| Ctrl+R | Put the profile back in place (profile open only) |
| E / A | Edit / Analyze tab of the tools panel |
| F | Fit view on tracks |
| + / − | Zoom in / out |
| Esc | Close open panel, cancel current action |
| ? | Show shortcuts |
On a Mac, Cmd replaces Ctrl.
Icon index
Some pictograms serve multiple purposes depending on where they appear. This index clears up ambiguity.
| Where | What it does | |
|---|---|---|
| 🔍 | Toolbar | Search for a place |
| Map buttons, track list | Fit all: frame all the tracks | |
| POI panel | Area tab | |
| Clean up panel | Show the next place | |
| 📍 | Toolbar | Points of interest |
| Map buttons | My location | |
| Edit menu, right-click | Place marker | |
| Auto loop | Choose start on the map | |
| Clean up panel | GPS spikes | |
| 📊 | Toolbar | Analyze menu |
| Analyze menu | Elevation profile, Compare tracks | |
| 🔄 | Draw menu | Auto loop |
| Edit menu | Loop the track | |
| Combine | Generate loops | |
| 🔗 | Toolbar | Combine |
| Edit menu | Merge | |
| Export window | Share a link | |
| Weather map forecast | Share a spot | |
| 🔀 | A POI's card | Add a detour |
| ↶ | Map buttons | Undo |
| 🧹 | Map buttons, track list | Delete all |
| 🗑️ | Everywhere | Delete the current item: track, point, marker, POI |
| 🗂️ | Map buttons | My workspace |
| 📐 | Map buttons | Units |
| 🗺️ | Map buttons | Map background |
| ⛶ | Map buttons | Fullscreen |
| Route window | Frame the route | |
| Profile | Display large | |
| 📷 | Bottom right, track list | GPS photos |
| Profile | Export the profile as PNG | |
| 👁️ / 🙈 | Track list | Show / hide a track |
| ⠿ | Lists | Drag to change the order |
| 📌 | Panels | Pin the open panel |
| Edit menu | Edit points | |
| ✔ / ✕ | Windows and banners | Confirm / cancel without saving |
| ? | Toolbar | Keyboard shortcuts |
| Track list | Sport not chosen yet | |
| 🌬️ | Toolbar | Weather map |
| ☆ / ★ | Weather map forecast | Add to my spots / remove |
| Weather map bar | ★ My spots: the list and the next windows | |
| ⚙ | Forecast for a saved spot | My conditions |
| 🌊 | Right-click near the coast | Tide here |
| ✉️ | Bottom right | Contact us |
| ❤️ | Bottom right | Support the project |